BNB Price Prediction 2026-2050: Forecast and Key Price Levels



BNB powers BNB Chain and the wider Binance ecosystem, which makes this Binance Coin price prediction closely tied to real network use. BNB currently trades at $692.66, about 49% below its all-time high. The forecasts below point to a range of $527.22 to $1,837 for 2026, with an average near $700.9. Long-term figures are scenarios, not promises, and they change as market data changes.
| Scenario | 2026 | 2030 | 2040 | 2050 |
|---|---|---|---|---|
| Bear Case | $527.22 | $957.1 | $3,523.15 | $5,213.68 |
| Base Case | $700.9 | $1,762.49 | $4,775.68 | $5,502.19 |
| Bull Case | $1,837 | $4,522 | $18,764 | $5,780.66 |
Article contents
- 1 What Is BNB and Why Does It Have Value?
- 2 BNB Price History
- 3 BNB Market Snapshot
- 4 BNB Chain Upgrades and Network Activity
- 5 Short-Term BNB Price Targets
- 6 What Drives the BNB Price?
- 7 Forecast Sources and Assumptions
- 8 Long-Term BNB Prediction (2026–2050)
- 9 BNB Technical Analysis and Key Levels
- 10 Can BNB Reach $1,000, $5,000 or $10,000?
- 11 Key Risks and Forecast Invalidation
- 12 Conclusion
- 13 BNB Price Prediction FAQ
What Is BNB and Why Does It Have Value?
BNB launched in 2017 as the Binance exchange token and later became the native coin of BNB Chain. Today it pays gas fees on BNB Smart Chain, secures the network through staking and serves as collateral across DeFi apps. On Binance, it is also used for trading-fee discounts and access to token sales.
The burn mechanism gives BNB a deflationary design. Every quarter, BNB Chain removes coins through Auto-Burn, and a share of gas fees is burned in real time. The 37th quarterly burn on October 19 destroyed 1,646,196.44 BNB, worth about $1.2 billion, leaving a total supply of about 131.51 million. The long-term target is 100 million BNB.
How BNB Burns Work
BNB uses two separate burn systems:
- Quarterly Auto-Burn: the amount depends on BNB’s price and the number of blocks produced on BNB Smart Chain during the quarter. The process is independent of the Binance exchange and can be checked on-chain, because the coins are sent to a public “blackhole” address.
- Real-time burn (BEP-95): part of the gas fees in every block is burned. According to BEP-95, the initial share was 10%, and validators can change it through governance.
After the Lorentz and Maxwell upgrades sped up block production, BNB Chain adjusted the Auto-Burn formula’s parameters to keep burns consistent with the original design. About 31.5 million BNB still separate today’s supply from the 100 million target. If quarterly burns stayed close to the latest size, reaching it would take roughly five years. Because Auto-Burn falls when the price rises, burns should not be treated as a fixed source of price growth.
BNB Price History
BNB started in 2017 as a token on Ethereum. It moved to its own network after the mainnet launch on April 18, 2019, and gradually became the gas coin of BNB Smart Chain.
The strongest move came in the 2025 cycle. BNB set its all-time high of $1,369.99 on October 13, 2025, but the rally did not hold. The coin traded near $1,094 at the start of November 2025 and finished the year around $861. The pullback continued in 2026, and BNB now trades about 30% lower than a year ago, although it is still up 17.5% over the last 90 days. Within the past month, it has moved between $691.46 and $800.91, and the current price sits near the bottom of that range.
BNB Market Snapshot
| Metric | Value |
|---|---|
| Current Price | $692.66 |
| Market Cap | $91.11 billion |
| Market Cap Rank | 4 |
| 24-Hour Trading Volume | $724.1 million |
| Circulating Supply | 131.51 million BNB |
| 30-Day Range | $691.46 to $800.91 |
| All-Time High | $1,369.99 (October 13, 2025) |
Market data: CoinGecko
BNB has fallen 1% over 24 hours, 6.7% over seven days and 13% over 30 days. Over the past year, it is down about 30%, although it gained about 17.5% over the last 90 days.
BNB Chain Upgrades and Network Activity
BNB Chain has focused on speed and lower costs. According to its 2026 tech roadmap, the Pascal, Lorentz, Maxwell and Fermi hard forks cut block time from 3 seconds to 0.45 seconds and finality from 7.5 seconds to about 1.1 seconds. Gas prices fell from 1 gwei to 0.05 gwei. Fermi went live on January 14, 2026, and the Pasteur upgrade followed on August 25, improving block building.
The latest quarterly data shows heavier use by fewer wallets. These figures come from the Blockworks Q3 2026 report, as summarized by TokenPost:
| Q3 2026 Metric | Value | Change From Q2 |
|---|---|---|
| Transactions | 1.51 billion | +7.5% |
| Daily Active Addresses | 2.1 million | -14% |
| Network Revenue | $54.2 million | +54% |
| Average Transaction Fee | $0.032 | +43% |
| Tokenized Stock Trading | $25.6 billion | Up from $2.4 billion |
| Lending Deposits | $3.57 billion | +42% |
| Stablecoin Supply | $13.22 billion | -4.6% |
Tokenized stocks were the biggest story. BNB Chain handled more than half of all tracked tokenized-asset DEX volume, and its bStocks product, launched in June, held about $810 million in supply by the end of September. Rising revenue matters for BNB because fees are paid in the coin and part of them is burned. The drop in active addresses and stablecoin supply shows that this growth is concentrated among fewer, more active users.
Short-Term BNB Price Targets
CoinCodex and Changelly both expect a modest recovery in November, while the year-end range is much wider.
| Period | Minimum Price | Average Price | Maximum Price | Change From Current Price |
|---|---|---|---|---|
| Next Month: November 2026 | $684.62 | $723.66 | $767.49 | +4% |
| In Six Months: April 2027 | $651.08 | $875.03 | $1,050.78 | +26% |
| End of Year 2026 | $527.22 | $700.9 | $1,837 | +1% |
For November, CoinCodex expects $694.59 to $767.49, while Changelly sees a similar band of $684.62 to $756.2. By April 2027, CoinCodex is the more bullish source with up to $1,050.78 (+52%). The end-of-year range is wide because CoinLore includes both a deep bear case and a strong bull case.
What Drives the BNB Price?
- BNB Chain activity: more transactions, DeFi deposits, tokenized assets and token launches increase demand for gas and staking.
- Binance exposure: BNB’s value is tied to the exchange. Growth in users and trading volume helps it, while legal or regulatory pressure on Binance hurts it.
- Token burns: quarterly burns reduce supply, but their size depends on price and on-chain activity.
- Bitcoin and liquidity: BNB’s correlation with BTC is high across all periods, so crypto-wide liquidity cycles remain a major driver.
- Competition and security: Ethereum, Solana and other chains compete for users and developers, and bridge hacks or centralization concerns can weigh on sentiment.
| Pair | 30-Day Correlation | 90-Day Correlation | 1-Year Correlation |
|---|---|---|---|
| BNB–BTC | +0.82 | +0.73 | +0.82 |
| BNB–ETH | +0.79 | +0.67 | +0.79 |
Based on CoinGecko daily prices.
The correlation stays above 0.67 in every period, so BNB rarely moves against the market for long. Over the past 90 days, BNB gained about 17.5%, slightly less than Bitcoin at 19.8% and Ethereum at 19.2%. In practice, BNB behaves like a large-cap asset that follows Bitcoin’s direction, with network-specific news adding or subtracting a few points.
Forecast Sources and Assumptions
The forecasts come from CoinCodex, Changelly and CoinLore, collected on the same day and compared with one current price of $692.66 from CoinGecko. In each row:
- Minimum (Bear case): the most bearish figure among them.
- Maximum (Bull case): the most bullish figure.
- Average (Base case): reflects all base forecasts.
These are third-party model outputs, not a StealthEX forecast. They usually rely on past price trends and market cycles, so a major change in Binance’s position, regulation or crypto liquidity can quickly make them outdated.
Long-Term BNB Prediction (2026–2050)
| Year | Minimum Price | Maximum Price | Average Price | Price Change | Implied Market Cap |
|---|---|---|---|---|---|
| 2026 | $527.22 | $1,837 | $700.9 | +1% | $92.2 billion |
| 2027 | $470.6 | $2,274.34 | $910.84 | +31% | $119.8 billion |
| 2028 | $579.16 | $2,421.3 | $1,568.37 | +126% | $206.3 billion |
| 2029 | $601.17 | $5,251 | $1,637.1 | +136% | $215.3 billion |
| 2030 | $957.1 | $4,522 | $1,762.49 | +154% | $231.8 billion |
| 2035 | $2,238 | $9,472 | $3,010.39 | +335% | $395.9 billion |
| 2040 | $3,523.15 | $18,764 | $4,775.68 | +589% | $628.1 billion |
| 2050 | $5,213.68 | $5,780.66 | $5,502.19 | +694% | $723.6 billion |
Implied market cap uses the average price and the current circulating supply. Burns would lower the supply, so the same price would mean a smaller market cap.
BNB Price Prediction 2026
BNB is expected to trade between $527.22 (-24%) and $1,837 (+165%), with an average of $700.9 (+1%).
- CoinCodex and Changelly: they place the 2026 average between $748.76 and $767.03, roughly 8% to 11% above today’s price.
- CoinLore: it adds the wide edges, with a fall toward $527.22 if the current downtrend continues, and $1,837 only in a strong altcoin rally.
BNB Price Prediction 2027
The 2027 range is $470.6 (-32%) to $2,274.34 (+228%), with an average of $910.84 (+31%).
- CoinCodex: the most optimistic, with an average of $1,453.41.
- Changelly: about $627.3, roughly 9% below the current price.
The gap between the two main models shows how uncertain the timing of the next cycle is: one expects a quick return above $1,000, the other a flat year. The upside case requires rising BNB Chain usage and a broader market recovery.
BNB Price Prediction 2028
BNB could trade between $579.16 (-16%) and $2,421.3 (+250%), with an average of $1,568.37 (+126%). CoinCodex and Changelly both see the average near $2,000, which assumes the next crypto cycle lifts large-cap assets.
BNB Price Prediction 2029
The forecasts suggest $601.17 (-13%) to $5,251 (+658%), with an average of $1,637.1 (+136%). CoinCodex and Changelly expect steady growth from 2028, while CoinLore’s $5,251 maximum is an outlier.
BNB Price Prediction 2030
The 2030 range is $957.1 (+38%) to $4,522 (+553%), with an average of $1,762.49 (+154%). At that average, BNB’s market cap would reach about $231.8 billion. Getting there requires continued BNB Chain adoption, steady burns and no major setback for Binance. Tokenized stocks and real-world assets are the clearest new source of demand: if Q3’s growth in that segment continues, it could support higher fee revenue and larger real-time burns.
BNB Price Prediction 2035
The three sources agree more closely here than in the late 2020s:
- CoinCodex: $2,759.04 (+298%) to $3,280.72 (+374%).
- Changelly: $2,707.19 (+291%) to $3,219.07 (+365%).
- CoinLore: a similar average of $3,085, but a range from $2,238 (+223%) to $9,472 (+1,267%).
The $3,010.39 average implies a market cap of about $395.9 billion, before any effect from future burns.
BNB Price Prediction 2040
This is a low-confidence horizon. The forecasts range from $3,523.15 (+409%) to $18,764 (+2,609%), with an average of $4,775.68 (+589%). The average implies a market cap of about $628.1 billion, while the $18,764 maximum would require about $2.47 trillion, so the bull case is much less likely than the others.
BNB Price Prediction 2050
Only CoinCodex and Changelly cover 2050, with a combined range of $5,213.68 (+653%) to $5,780.66 (+735%) and an average of $5,502.19 (+694%). This is a speculative scenario that assumes decades of adoption and a much smaller supply. If burns reach the 100 million target by then, the $5,502.19 average would mean a market cap of about $550.2 billion rather than $723.6 billion. That makes the long-term targets slightly less demanding than the table suggests.
BNB Technical Analysis and Key Levels
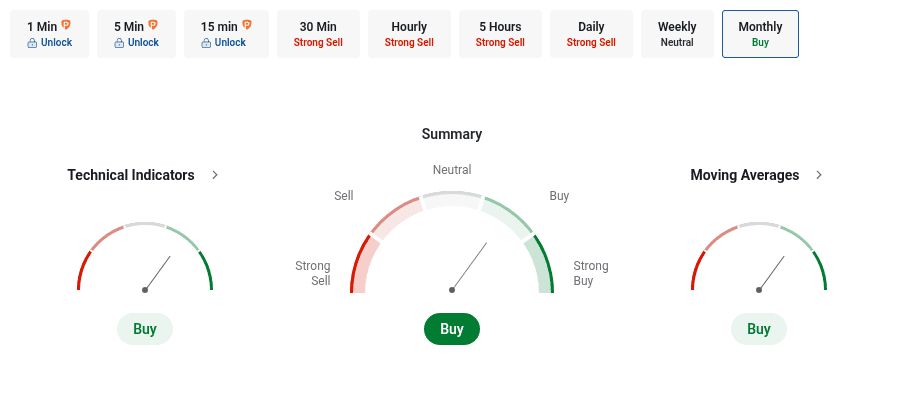
Investing.com gives BNB an overall Buy rating on the monthly timeframe. Technical indicators are Buy (4 buy, 2 neutral, 3 sell), and moving averages also signal Buy (8 buy, 2 sell).
Investing
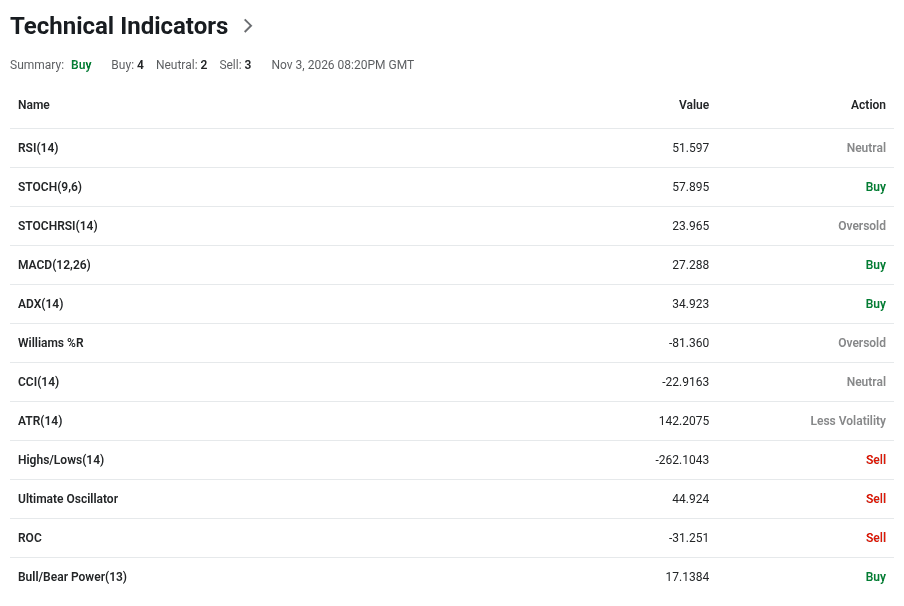
The monthly RSI (14) stands at 51.6, a neutral reading. MACD at 27.288 still signals Buy, and ADX at 34.923 confirms a strong long-term trend. STOCHRSI and Williams %R are oversold, which shows that the recent pullback has been sharp.
Investing
| Indicator | Current Value | Signal |
|---|---|---|
| RSI (14) | 51.6 | Neutral |
| MACD (12,26) | 27.288 | Buy |
| ADX (14) | 34.923 | Buy |
| STOCH (9,6) | 57.895 | Buy |
| STOCHRSI (14) | 23.965 | Oversold |
| Williams %R | -81.36 | Oversold |
| CCI (14) | -22.9163 | Neutral |
| Ultimate Oscillator | 44.924 | Sell |
| ROC | -31.251 | Sell |
| Bull/Bear Power (13) | 17.1384 | Buy |
| MA5 (simple / exponential) | $688.96 / $693.38 | Buy / Buy |
| MA10 (simple / exponential) | $655.14 / $694.71 | Buy / Sell |
| MA20 (simple / exponential) | $736.23 / $686.79 | Sell / Buy |
| MA50 (simple / exponential) | $547.82 / $571.29 | Buy / Buy |
| MA100 (simple / exponential) | $355.82 / $357.4 | Buy / Buy |
Investing
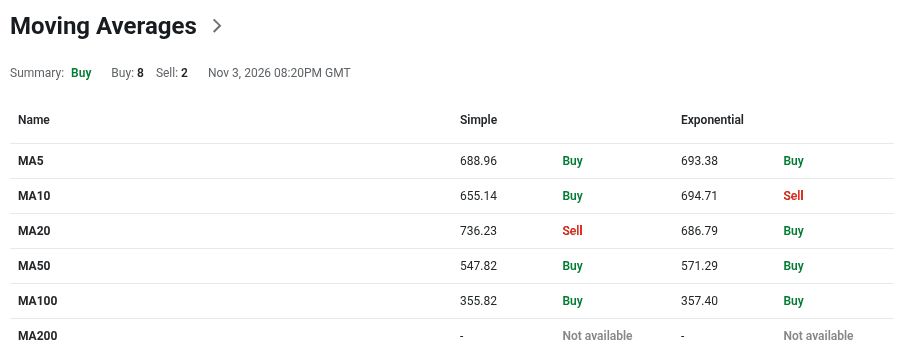
BNB trades above most monthly moving averages, which keeps the long-term structure positive. The 20-month simple MA at $736.23 and the 10-month EMA at $694.71 are the levels to reclaim. The oscillators are mixed: ROC and the Ultimate Oscillator lean Sell after the 2026 decline, while Bull/Bear Power and MACD still favor buyers.
Investing.com’s monthly classic pivots put the pivot point at $731.93, about 6% above the current price.
| Level | USD Price |
|---|---|
| Resistance 3 | $908.27 |
| Resistance 2 | $858.94 |
| Resistance 1 | $781.27 |
| Pivot Point | $731.93 |
| Support 1 | $654.27 |
| Support 2 | $604.93 |
| Support 3 | $527.27 |
BNB trades between S1 at $654.27 and the pivot at $731.93. A monthly close below S1 would open the way to S2 at $604.93, while a move back above the pivot would put R1 at $781.27 and the upper end of the November forecasts in focus.
Can BNB Reach $1,000, $5,000 or $10,000?
Can BNB Reach $1,000?
BNB needs about a 44% gain to reach $1,000, which implies a market cap of about $131.5 billion. It traded above this level for part of 2025, and CoinCodex already sees up to $1,050.78 by April 2027, so $1,000 is a realistic medium-term target. Technically, BNB would first need to clear the R3 pivot at $908.27. The average forecasts cross $1,000 in 2028.
Can BNB Reach $5,000?
$5,000 requires a 7.2x gain and a market cap of about $657.6 billion at the current supply. The forecasts reach this level only around 2040, which means BNB would need far larger adoption than today.
Can BNB Reach $10,000?
$10,000 implies a 14.4x gain and a market cap of about $1.3 trillion. Only the most bullish 2040 scenario goes above it. $100,000 is unrealistic, as it would require a market cap above $13 trillion.
Key Risks and Forecast Invalidation
- Regulation: new action against Binance could hurt demand for BNB.
- Binance dependence: a drop in exchange users or volume would weaken BNB’s utility.
- Competition: other chains could take users and liquidity from BNB Chain.
- Security: smart-contract or bridge incidents can damage trust.
- Centralization concerns: close ties to Binance remain a common criticism of BNB Chain.
- Falling user count: daily active addresses dropped 14% in Q3, so growth relies on a smaller group of heavy users.
- Liquidity cycles: a falling Bitcoin market usually drags BNB lower.
The base case would weaken if BNB loses the $604.93 support, if burns shrink as on-chain activity falls, or if regulation turns against Binance. A monthly close below S3 at $527.27 would put the bear-case targets for 2026 and 2027 in focus. On the other hand, a return above $781.27 and growing network revenue would support the bullish scenarios.
Conclusion
The base case points to a flat 2026 and gradual growth afterward, with an average of $1,762.49 for 2030. Upside depends on BNB Chain adoption, burns and a stronger crypto market, while Binance-related risks and competition remain the main threats. Long-range targets for 2040 and 2050 are scenarios rather than forecasts.
In the near term, the signals to watch are the $654.27 support, the next quarterly burn and whether Q4 data confirms the rise in network revenue. Faster blocks and cheaper gas have already made BNB Chain more competitive, but those gains have not yet stopped the price decline that began after the 2025 peak.

BNB Price Prediction FAQ
Is BNB a Good Investment?
BNB has strong utility, a deflationary supply and a Buy rating on the monthly chart. It can suit long-term investors, but its value depends heavily on Binance and the wider market.
What Is the BNB Price Prediction for 2026?
BNB is expected to trade between $527.22 and $1,837 in 2026, with an average of $700.9.
What Is the BNB Price Prediction for 2030?
BNB could trade between $957.1 and $4,522 in 2030, with an average of $1,762.49.
What Is the BNB Price Prediction for 2040?
The 2040 range is $3,523.15 to $18,764, with an average of $4,775.68. This horizon carries very high uncertainty.
Does BNB Have a Maximum Supply?
Yes. BNB burns aim to reduce the total supply to 100 million coins. About 131.51 million BNB exist now.
How Fast Is BNB Chain?
After the Fermi upgrade, BNB Smart Chain produces a block about every 0.45 seconds, with finality in a little over one second. Gas prices have dropped to about 0.05 gwei.
What Is the BNB All-Time High?
BNB reached its all-time high of $1,369.99 on October 13, 2025. It would need about a 98% gain to return there.
Don’t forget to do your own research before buying any crypto. The views and opinions expressed in this article are solely those of the author.
Binance BNB crypto price prediction price analysis price predictionRecent Articles on Cryptocurrency