Hedera HBAR Price Prediction 2026–2040: Long-Term Forecast

Hedera is a public network governed by a council of large companies, built for payments, tokenization and, more recently, AI agents. This Hedera HBAR price prediction looks at whether enterprise adoption can lift HBAR after a weak year, with forecasts up to 2050. HBAR currently trades at $0.0713, compared with a 30-day range of $0.0687 to $0.1044.
| Scenario | 2026 | 2030 | 2040 |
|---|---|---|---|
| Bear Case | $0.0487 | $0.1242 | $0.2114 |
| Base Case | $0.0919 | $0.2149 | $0.2528 |
| Bull Case | $0.1504 | $0.5278 | $0.303 |
Article contents
- 1 Hedera Market Overview
- 2 What Is Hedera (HBAR)?
- 3 HBAR Price History
- 4 How the HBAR Forecast Is Built
- 5 Short-Term Hedera Price Prediction
- 6 Hedera Price Prediction 2026–2050
- 7 How High Can HBAR Go?
- 8 When Is the Next HBAR Bull Run?
- 9 Factors That Could Affect HBAR’s Price
- 10 Hedera Technical Analysis
- 11 Hedera Risks
- 12 Is Hedera a Good Investment?
- 13 Hedera Price Prediction FAQ
Hedera Market Overview
HBAR has slipped 0.8% over 24 hours, 6.9% over the week and 29.4% over 30 days. Over the past year, it is down about 64%. According to CoinGecko, Hedera’s market capitalization is about $3.16 billion, ranking it 32nd among cryptocurrencies, with 24-hour trading volume near $38.1 million. About 44.33 billion HBAR are in circulation out of a fixed maximum supply of 50 billion.
The network keeps shipping. Hedera introduced Agent Accounts, non-custodial spending accounts that let AI agents pay in HBAR or USDC within on-chain limits; testnet access is planned for Q4 2026 and mainnet for Q2 2027. Mainnet also moved to release v0.78, which, according to the release notes, improves Block Node reliability and adds groundwork for cross-ledger messaging. In addition, the HashPack wallet added tokenized Apple, Nvidia, Tesla and S&P 500 ETF products on Hedera, TokenPost reports.
Usage is rising, but the token has not followed. According to 24/7 Wall St., citing Token Relations, network transactions rose about 168% over 30 days, while total value locked grew 12.3% to $33.2 million. In the same period, Hedera joined the UK’s Wholesale Digital Markets Champion Taskforce and made its cross-ledger protocol, CLPR, open source through the Linux Foundation’s Decentralized Trust Labs.
News-driven rallies have also faded fast. HBAR jumped 27% on September 28 after IBM added a Hedera-based identity app to its cloud offerings, then lost 16% the next day. That pattern helps explain why forecasts remain cautious despite a busy news flow.
What Is Hedera (HBAR)?
Hedera uses hashgraph consensus instead of a traditional blockchain, which allows transaction finality in seconds and fees priced in fixed US dollar amounts. The network is governed by the Hedera Council, a group of global organizations that run its nodes. Recent members include Accenture and McLaren Racing, according to Hedera.
HBAR is used to pay network fees, power smart contracts and stake to help secure the network. Investors can also gain exposure through the Canary HBAR ETF, which holds about $58 million in net assets.
HBAR Supply, Fees and Staking
Hedera launched with a total supply of 50 billion HBAR. According to the Hedera Council, this total cannot be changed without the unanimous consent of all council members. The roughly 5.7 billion HBAR outside circulation are managed by the council’s treasury.
Fees are set in US dollars and converted into HBAR at the network exchange rate, so costs stay stable even when the token price moves. Typical base fees from the Hedera documentation look like this:
| Operation | Base Fee in USD |
|---|---|
| HBAR transfer | $0.0001 |
| Consensus message (up to 100 bytes) | About $0.00017 |
| New account | $0.05 |
| New token | $1 |
Since HIP-1259, all fees go to a single collection account and are distributed once a day to node operators, the staking reward pool and the network treasury. This is also the main weakness for investors: with fees this low, even a sharp rise in transactions creates little direct demand for HBAR.
Staking does not require a minimum amount. An account earns rewards only if it stays staked for a full 24-hour period that starts at midnight UTC, and rewards can be collected for up to 365 days back, according to the staking documentation.
Main Use Cases
- Payments: fixed, sub-cent fees make Hedera suitable for frequent small transfers, including stablecoin payments.
- Data logging: the Consensus Service lets companies timestamp and order records without running their own blockchain.
- Tokenization: the Token Service supports assets such as the tokenized stocks now offered through HashPack.
- Identity and AI agents: IBM’s identity app and the upcoming Agent Accounts show how Hedera wants to serve enterprise and automated users.
HBAR Price History
HBAR set its all-time low of $0.00986 in early 2020, when the network was still young and trading volumes were thin. It then reached its all-time high of $0.5692 on September 15, 2021, during the last major altcoin cycle. The token fell sharply during the 2022 bear market.
The 2025 rally did not last. HBAR traded near $0.2 at the start of November 2025 and finished the year around $0.11, so the year closed far below the levels many bullish forecasts had expected. The decline continued in 2026. HBAR spent much of the summer near $0.07, rallied to about $0.122 in late September on the IBM news, and then gave back the entire move. It lost almost 30% of its value over the last 30 days alone and now trades about 87% below its all-time high.
How the HBAR Forecast Is Built
The forecasts below come from CoinCodex, Changelly and CoinDataFlow. The minimum shows the most bearish figure among them, the maximum the most bullish one, and the average price reflects all base forecasts. CoinDataFlow does not cover 2040 and 2050, so those years rely on CoinCodex and Changelly.
Short-Term Hedera Price Prediction
CoinCodex and Changelly expect HBAR to trade higher over the coming months, while CoinDataFlow is more cautious.
| Period | Minimum Price | Average Price | Maximum Price | Change From Current Price |
|---|---|---|---|---|
| Next Month: November 2026 | $0.0713 | $0.0938 | $0.127 | +32% |
| In Six Months: April 2027 | $0.0692 | $0.11 | $0.1296 | +54% |
| End of Year 2026 | $0.0487 | $0.0919 | $0.1504 | +29% |
For November, CoinCodex expects $0.0713 to $0.1269, and Changelly sees a similar band of $0.0713 to $0.127 with a higher average of $0.0992. CoinDataFlow takes the opposite view, targeting $0.0531 (-26%) over the next month.
For the year-end, CoinCodex sees $0.1504 (+111%), and Changelly’s range is $0.0778 to $0.127. CoinDataFlow expects HBAR to stay close to today’s price, between $0.0487 and $0.0779.
Hedera Price Prediction 2026–2050
The table shows average forecasts and the market cap they would imply at the current circulating supply. These are model-generated estimates, not guaranteed outcomes.
| Year | Minimum Price | Maximum Price | Average Price | Price Change | Implied Market Cap |
|---|---|---|---|---|---|
| 2026 | $0.0487 | $0.1504 | $0.0919 | +29% | $4.07 billion |
| 2027 | $0.0467 | $0.1709 | $0.096 | +35% | $4.26 billion |
| 2028 | $0.0823 | $0.25 | $0.1615 | +127% | $7.16 billion |
| 2029 | $0.083 | $0.7329 | $0.2564 | +260% | $11.37 billion |
| 2030 | $0.1242 | $0.5278 | $0.2149 | +201% | $9.53 billion |
| 2035 | $0.1691 | $1.18 | $0.4055 | +469% | $17.97 billion |
| 2040 | $0.2114 | $0.303 | $0.2528 | +255% | $11.21 billion |
| 2050 | $0.3224 | $0.438 | $0.3566 | +400% | $15.81 billion |
CoinDataFlow is the most bullish source from 2029 onward, which is why the 2029 and 2035 maximums stand out. Without it, the 2040 average sits below the 2035 one.
Hedera Price Prediction 2026
CoinCodex expects HBAR to trade between $0.0713 (0%) and $0.1504 (+111%). Changelly’s range is $0.0778 (+9%) to $0.127 (+78%), while CoinDataFlow sees $0.0487 (-32%) to $0.0779 (+9%).
Reaching the $0.0919 average would require a gain of about 29% in the weeks left in the year. That looks ambitious given the Strong Sell monthly rating, so CoinDataFlow’s lower range is a useful reminder of the downside.
Hedera Price Prediction 2027
CoinCodex forecasts $0.0835 (+17%) to $0.1709 (+140%). Changelly sees $0.052 (-27%) to $0.133 (+87%), and CoinDataFlow $0.0467 (-34%) to $0.1277 (+79%). The averages sit close together, between $0.0872 and $0.1083.
Hedera Price Prediction 2028
CoinCodex expects $0.0986 (+38%) to $0.2485 (+249%). Changelly’s range is $0.0992 (+39%) to $0.25 (+251%), close to CoinDataFlow’s $0.0823 (+15%) to $0.2167 (+204%).
Hedera Price Prediction 2029
CoinDataFlow is far more bullish this year, with $0.1917 (+169%) to $0.7329 (+928%). CoinCodex and Changelly stay near $0.083 to $0.257.
Hedera Price Prediction 2030
CoinCodex places HBAR between $0.1242 (+74%) and $0.2115 (+197%). Changelly sees $0.125 (+75%) to $0.213 (+199%), while CoinDataFlow expects $0.1422 (+99%) to $0.5278 (+640%).
The $0.2149 average would put Hedera’s market cap near $9.53 billion, still well below the roughly $25 billion the current supply would be worth at the all-time high. This is the year when Agent Accounts and tokenization products should be mature enough to show whether they bring real demand.
Hedera Price Prediction 2035
CoinCodex forecasts $0.1691 (+137%) to $0.2119 (+197%), and Changelly $0.171 (+140%) to $0.214 (+200%). CoinDataFlow’s range of $0.5224 (+633%) to $1.18 (+1,555%) is the only one above $1.
Hedera Price Prediction 2040
CoinCodex expects $0.2114 (+196%) to $0.2995 (+320%), while Changelly sees $0.213 (+199%) to $0.303 (+325%). The 2040 average is lower than the 2035 one only because CoinDataFlow’s bullish figures drop out of the comparison. The two remaining models describe slow, steady growth rather than a new bull cycle.
Hedera Price Prediction 2050
CoinCodex estimates $0.3224 (+352%) to $0.432 (+506%), and Changelly $0.326 (+357%) to $0.438 (+514%). Even these long-term targets stay below the all-time high of $0.5692.
How High Can HBAR Go?
Can HBAR Return to $0.5?
A move back to about $0.5, close to the all-time high, would take a gain of roughly 600% and a market cap of about $22.2 billion. Only CoinDataFlow’s bullish ranges for 2029, 2030 and 2035 go that high. CoinCodex and Changelly keep HBAR below $0.5 even in 2050, so a return to the 2021 peak would need adoption well beyond what most models assume.
Can HBAR Reach $1 or $5?
HBAR at $1 would require a 14x gain and a market cap of about $44.3 billion at the current supply. Only CoinDataFlow’s 2035 maximum of $1.18 goes above that level. $5 would imply a market cap of about $221.6 billion, which none of the forecasts supports.
Can HBAR Reach $10, $20 or $100?
These targets are not realistic within the forecast horizon. $10 would value HBAR at about $443.3 billion, $20 at $886.5 billion, and $100 at more than $4.4 trillion. Almost 89% of the 50 billion supply already circulates, so the price cannot rely on a smaller float, and none of the forecasts reviewed here goes above $1.18.
When Is the Next HBAR Bull Run?
The forecasts point to gradual gains in 2028 and 2029 rather than a quick rebound. HBAR’s 1-year correlation with Bitcoin is 0.65, so a new altcoin rally led by BTC remains the most likely trigger.
Network-specific catalysts could add to that move. The main ones to watch are the Agent Accounts mainnet launch planned for Q2 2027, ETF inflows and proof that tokenized assets on Hedera generate steady activity. Without them, HBAR is likely to keep reacting to headlines and then giving back the gains.
Factors That Could Affect HBAR’s Price
- Adoption: real use of Agent Accounts, tokenized assets and payments on Hedera matters more than announcements.
- Supply and staking: the 50 billion supply is fixed, and about 5.7 billion HBAR are still outside circulation.
- ETF and regulation: ETF inflows and clear US rules could widen access, while council decisions shape the network’s direction.
- Interoperability: the open-source CLPR protocol and cross-ledger work in release v0.78 could make it easier to move assets and data between Hedera and other networks.
- Liquidity and Bitcoin: HBAR’s 30-day correlation with BTC is 0.75, so market-wide sell-offs hit it quickly.
| Pair | 30-Day Correlation | 90-Day Correlation | 1-Year Correlation |
|---|---|---|---|
| HBAR–BTC | +0.75 | +0.45 | +0.65 |
| HBAR–ETH | +0.75 | +0.45 | +0.63 |
The figures are based on CoinGecko daily prices. Over the past 90 days, HBAR was roughly flat (+1.7%), while BTC gained about 23.4% and ETH 22.4%.
Hedera Technical Analysis
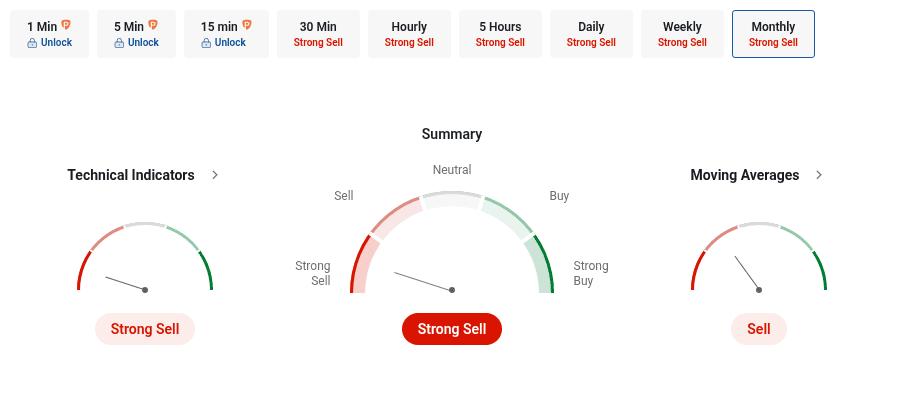
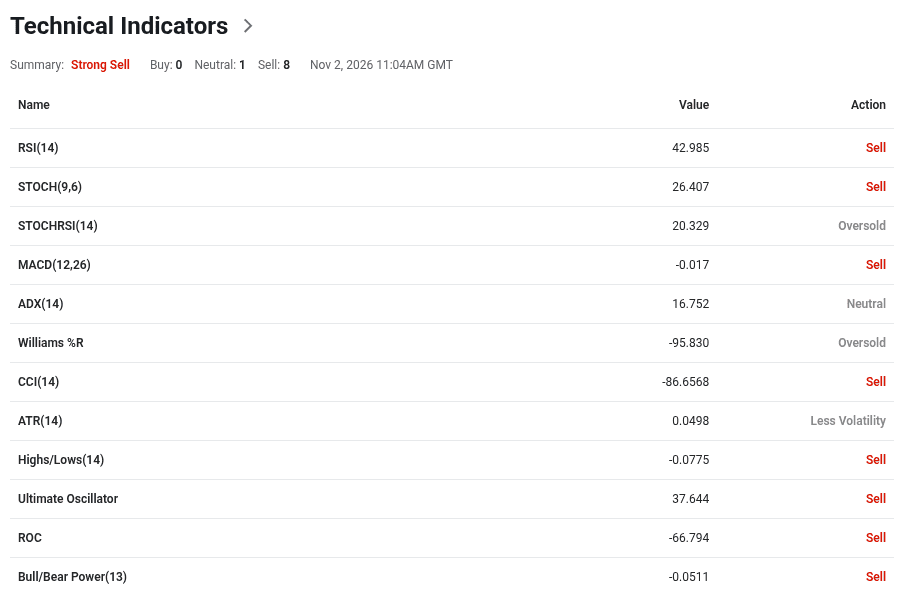
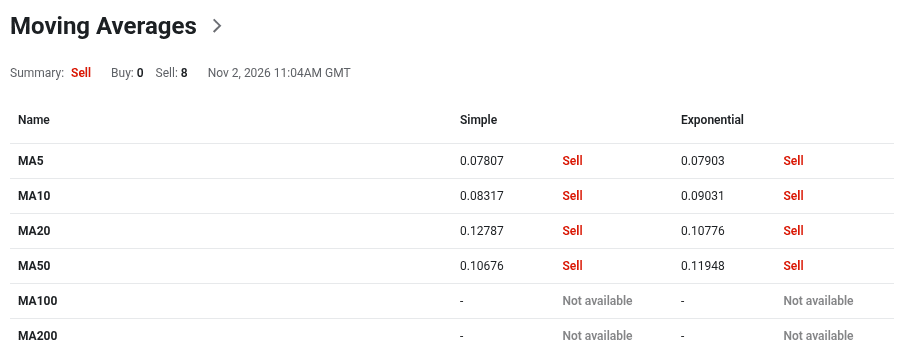
Investing.com gives HBAR an overall Strong Sell rating on the monthly timeframe. Technical indicators signal Strong Sell (1 neutral, 8 sell), and moving averages signal Sell (8 sell).
Investing
The monthly RSI (14) sits at 42.985 and signals Sell, while MACD at -0.017 confirms bearish momentum. ADX at 16.752 is Neutral, which suggests the trend is not especially strong. STOCHRSI and Williams %R are oversold.
Investing
| Indicator | Current Value | Signal |
|---|---|---|
| RSI (14) | 42.985 | Sell |
| MACD (12,26) | -0.017 | Sell |
| ADX (14) | 16.752 | Neutral |
| Williams %R | -95.83 | Oversold |
| STOCH (9,6) | 26.407 | Sell |
| STOCHRSI (14) | 20.329 | Oversold |
| CCI (14) | -86.6568 | Sell |
| Ultimate Oscillator | 37.644 | Sell |
| ROC | -66.794 | Sell |
| MA5 (simple / exponential) | $0.0781 / $0.079 | Sell / Sell |
| MA10 (simple / exponential) | $0.0832 / $0.0903 | Sell / Sell |
| MA20 (simple / exponential) | $0.1279 / $0.1078 | Sell / Sell |
| MA50 (simple / exponential) | $0.1068 / $0.1195 | Sell / Sell |
MA100 and MA200 are excluded because Investing.com does not show monthly values for them.
Investing
HBAR trades below every monthly moving average. On the daily chart, CoinCodex places the 50-day SMA at $0.0874 and the 200-day SMA at $0.0811, both above the current price.
Investing.com’s monthly classic pivots for November put the pivot point at $0.0819, about 15% above the current price.
| Level | USD Price |
|---|---|
| Resistance 3 | $0.1367 |
| Resistance 2 | $0.1218 |
| Resistance 1 | $0.0968 |
| Pivot Point | $0.0819 |
| Support 1 | $0.0569 |
| Support 2 | $0.042 |
| Support 3 | $0.0171 |
HBAR trades between S1 at $0.0569 and the pivot at $0.0819. A monthly close under S1 would put S2 at $0.042 in focus, while a move above the pivot and then R1 at $0.0968 would be the first sign that the monthly downtrend is losing strength.
Hedera Risks
HBAR has lost 64% over the past year, and every monthly moving average signals Sell. The main risks are:
- Weak link between usage and price: fees are a fraction of a cent, so more transactions do not automatically create token demand.
- Sell-the-news behavior: rallies on partnership headlines, such as the IBM announcement, have reversed within days.
- Governance concentration: the council runs the consensus nodes and controls the treasury, which some investors see as less decentralized than rival networks.
- Remaining supply: about 5.7 billion HBAR can still enter circulation.
- Competition and timing: other networks target the same payment and tokenization markets, and Agent Accounts are not yet on mainnet.
Is Hedera a Good Investment?
Hedera has a clear enterprise focus, fixed US dollar fees, a capped supply and a growing list of council members. New products for AI agents and tokenized assets give it a credible adoption story, and an ETF offers regulated exposure.
The price trend is still negative, though. The forecasts point to a slow recovery rather than a return to the all-time high, with average targets of $0.2149 for 2030 and $0.2528 for 2040. HBAR may suit long-term investors who believe in enterprise blockchain adoption and accept high volatility.
The signals worth tracking are a monthly close above the $0.0819 pivot, the Agent Accounts testnet in Q4 2026 and growth in ETF assets. The Canary fund’s roughly $58 million equals less than 2% of Hedera’s market cap, so institutional demand is still small.

Hedera Price Prediction FAQ
What Is the HBAR Price Prediction for 2026?
HBAR is expected to trade between $0.0487 and $0.1504 in 2026, with an average of $0.0919, about 29% above the current price.
What Is the HBAR Price Prediction for 2030?
HBAR could trade between $0.1242 and $0.5278 in 2030, with an average of $0.2149.
Can HBAR Reach $1?
It is possible but not likely soon. $1 requires a 14x gain and a market cap of about $44.3 billion. Only the most bullish 2035 scenario goes above $1.
What Is the HBAR Price Prediction for 2040?
HBAR is expected to trade between $0.2114 and $0.303 in 2040, with an average of $0.2528.
How Much Does a Hedera Transaction Cost?
A basic HBAR transfer costs about $0.0001. Fees are set in US dollars and paid in HBAR, so the cost stays stable when the token price changes.
Is There an HBAR ETF?
Yes. The Canary HBAR ETF holds about $58 million in net assets, which gives investors regulated exposure to HBAR without holding the token directly.
Is HBAR a Good Long-Term Investment?
HBAR has strong enterprise backing and a fixed supply, but the monthly rating is Strong Sell and long-term targets stay below the all-time high. It suits patient, risk-tolerant investors.
Don’t forget to do your own research before buying any crypto. The views and opinions expressed in this article are solely those of the author.
crypto price prediction HBAR Hedera Hashgraph price analysis price predictionRecent Articles on Cryptocurrency