Crypto Technical Analysis vs Fundamental Analysis: Which One Is Better?

When it comes to the crypto market and its movements, it’s crucial for a crypto enthusiast or trader to navigate the field in order to be successful. Figuring out which cryptocurrency may be a good investment or trading option can be challenging. In this article, we’ll try to take a closer look at crypto technical analysis and fundamental analysis of cryptocurrency.
Traders often see natural corrections in prices over short periods that don’t disrupt the overall trends seen in long periods. If the market is bullish for a substantial amount of time, demand will reduce the supply of coins for sale and the price will increase. As the price goes up, you can expect it to become bearish at some point as people try to capitalize by selling their coins. As they sell, supply begins to outweigh demand, causing the price to go down.

Price corrections can happen within days, if not hours, and are what day traders look for in order to make a profit. However, those looking for long-term profits will look at longer periods. And in order to make an informed investment decision, it is important to know how to analyze cryptocurrencies. Here is where technical and fundamental analysis come in.
Article contents
What Is Crypto Technical Analysis?
Technical analysis involves using mathematical indicators to evaluate statistical trends to predict price direction in the crypto market. This is done by looking at past price changes and volume data to determine how the market works and predict how it will affect future price changes.
Technical analysis methods evaluate crypto markets and identify trading opportunities through price trends and patterns seen on charts. They are based on the belief that a crypto’s past trading activity and price changes are valuable indicators in determining future price and activity.
Cryptocurrency Analysis Tools
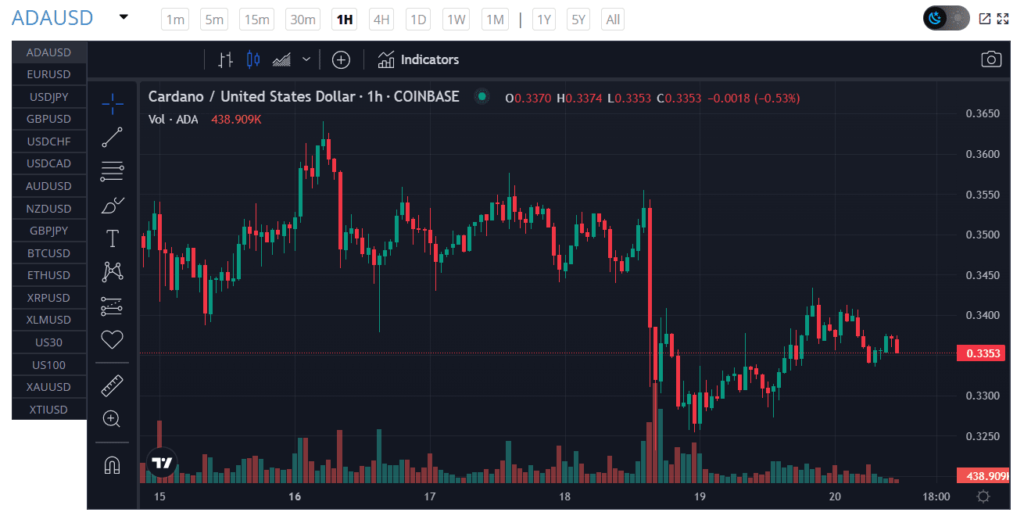
Techno analysis in crypto involves well-known tools, including trends and indexes. One of the most popular methods is candlestick charts. Traders prefer candlestick charts because they show more information about price movement. Each candlestick represents the activity around the timeframe you choose for trade analysis. Candlesticks consist of a body and wicks. The body can either be green (increase) or red (declines). Green candlesticks indicate that a trade closed higher than its opening price. On the other hand, the red candlesticks show that the trade closed lower than the opening price. The candlestick’s wick shows how high and low the price was within the timeframe.

ADA/USD Chart, Cashbackforex.com, January 20, 2023
Another popular method is understanding support and resistance levels, this helps traders interpret charts. They are specific price levels that the market finds difficult to exceed. A support level is a point where prices stop moving lower, while resistance is the point where the market price can’t increase further. Once you identify these levels, you can use them to form your market price predictions.
Trend lines can also be used to determine any future coin price growth and can help you draw out potential trends in the market. Traders also draw out multiple trend lines to draw out more complex patterns.
One more method to navigate the crypto charts is the Relative Strength Index. The RSI is an oscillatory indicator that shows whether an asset is overbought or oversold. It measures in the range of 0 to 100. Once the RSI value of a crypto asset is below 30, it is oversold, and when the RSI value moves above 70, it indicates an overbought asset price. An overbought state is a potential sell signal, while an oversold state indicates a potential buy opportunity.
Bitcoin Technical Analysis
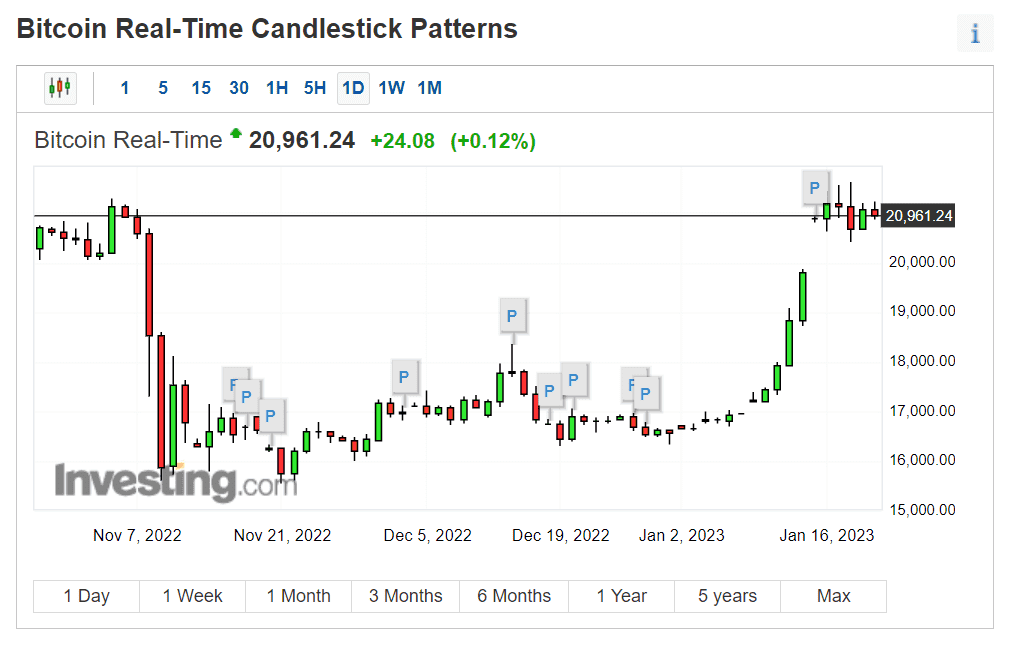
Technical analysis of Bitcoin might be complicated, but there are various signs and tools you can use to make better judgments. The overall chart analysis shows the following:

BTC Chart, Investing.com, January 20, 2023
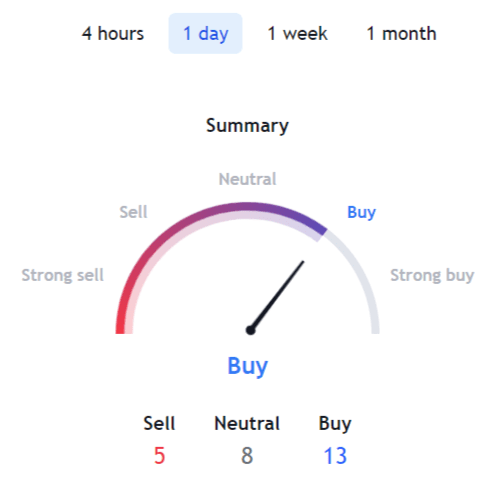
Believe it or not, Bitcoin is still trending up on the monthly time frame. However, BTC has recently crossed down and needs to recapture the trend line. You can additionally find the most relevant data and Bitcoin technical analysis (BTC/USD), along with Ethereum technical analysis (ETH/USD), on TradingView. Charting tools like TradingView, news aggregators, portfolio rebalancing, and block explorers all enhance a data-rich crypto environment:

BTC/USD Technical Analysis, TradingView, January 20, 2023
Fundamental Analysis in Crypto
Being good at technicals doesn’t always make a good trader. Fundamental crypto analysis can also help you make more informed decisions. Fundamental analysis determines the intrinsic value of an asset, which is meant to be an objective measure of its worth. Evaluating the underlying information about crypto projects provides guidance on whether the coin is undervalued or overvalued as an asset.
Cryptocurrency markets are notoriously volatile. Even established currencies like Bitcoin and Ethereum are subject to sudden fluctuation. Investing in newer coins and tokens comes with significant risk unless you understand what you’re putting your money into. Performing fundamental analysis enables non-technical investors and seasoned traders to trade market movements with confidence. Armed with fundamental analysis, traders can create informed strategies with better odds of profitability.
Blockchain Metrics (On-chain Metrics)
The blockchain is a valuable resource, but pulling information manually from the raw data can drain time and resources. Fortunately, a range of application programming interfaces (APIs) provide tools to empower investment decisions. Leading cryptocurrency exchanges have developed reporting tools that provide an abundance of actionable information such as the number of active users, total transactions, and transaction value.
The three most fundamental metrics to a cryptocurrency’s fundamental analysis are hash rate, status, and active addresses, as well as transaction values and fees. Hash rates are seen by many crypto investors as proof of the health of the cryptocurrency in question. The higher the hash rate, the more miners are incentivized to mine for profits, and the more secure the network. Calculating a personal hash rate can also help miners determine their own profitability.
Active addresses measure the number of active blockchain addresses over a period of time. One of the simplest approaches is to total the number of sending and receiving addresses over various periods. As compared to technical analysis, the fundamental analysis also prioritizes the assessment of transaction values. A consistently high transaction value shows a currency in steady circulation, while comparisons reveal data concerning potential future market movements.
The goal of fundamental analysis is to produce a quantitative value for an investor to analyze the prospect of an asset. Assessing crypto financially involves understanding the trading conditions of assets including their liquidity, surrounding factors, and market response. All of these proves to be valuable crypto fundamental analysis, especially when assessing the prospect before formulating an investment plan.
Fundamental Analysis: What Else Can We Analyze?
We have earlier discussed market cap. The market capitalization value is the representation of a network’s value. In general, investors may believe that low market cap coins have higher growth potential, though high market caps can also point to stronger infrastructure and lasting power.
Another vital indicator is a coin’s liquidity. Liquidity is a measure of how easy it is to buy and sell an asset. If a cryptocurrency asset can be quickly bought or sold without drastically altering the market value, then liquidity is strong. A liquid cryptocurrency coin or token will have many buyers and sellers in an order book waiting to be filled. This, in turn, narrows the bid-ask spread, which is a solid measure of liquidity.
Trading volume is one more useful indicator of a coin or token’s ability to sustain momentum. The measure shows how many units of an asset have changed hands over a specific period. If an upward trend in value is backed by a high trading volume, the gains may be more likely to stick.
The circulating supply of a cryptocurrency refers to the total number of coins in active supply that are accessible to the public. Different from the total supply or the maximum potential supply, the circulating supply isn’t static and can change over time since coins can be burned. Developers may increase the number of coins or tokens circulating in a centralized supply. With a mineable cryptocurrency, mining activities can increase the circulating supply.
Additionally, traders and investors can analyze the background of a crypto project and its white paper, compare the coin against its competitors, find out more about its tokenomics and utility, etc.
Crypto Technical Analysis vs Fundamental Analysis
Fundamental analysis is used to understand how a particular company performs in its industry. This is achieved by analyzing a company’s financial statements, earnings reports, analyst reports, and specific industry conditions. The goal is to determine the intrinsic value of a company and compare it to the market price. Is the company overvalued or undervalued?
On the other hand, technical analysis is also very popular in determining when to best enter or exit the market. This is done through price analysis using technical indicators as well as significant price levels to open or close trading positions.
While some analysts only focus on the fundamentals of an asset, others prefer to look at the price action. But a more sensible approach would be to use a combination of both – evaluating the conclusions of one against the data provided by the other.
If you are looking to buy crypto safely, you can always use the user-friendly and non-custodial StealthEX crypto exchange platform. You can purchase crypto privately and without the need to sign up for the service. Our crypto collection has more than 650 different coins and you can do wallet-to-wallet transfers instantly and problem-free.
Just go to StealthEX and follow these easy steps:
- Choose the pair and the amount you want to exchange. For instance, BTC to ETH.
- Press the “Start exchange” button.
- Provide the recipient address to transfer your crypto to.
- Process the transaction.
- Receive your crypto coins.
Make sure to follow us on Medium, Twitter, Telegram, YouTube, and Publish0x to stay updated about the latest news on StealthEX.io and the rest of the crypto world.
Don’t forget to do your own research before buying any crypto. The views and opinions expressed in this article are solely those of the author.
crypto market cap cryptocurrency market fundamental analysis price analysis technical analysisRecent Articles on Cryptocurrency
 Top Monero Faucets to Earn Free XMR: A Comprehensive Guide
  Crypto News Roundup: MonoSwap Hack, dYdX Attack, Ethereum ETFs
