Zama Price Prediction for 2026, 2027–2030 & Beyond

Zama price predictions have attracted more attention after ZAMA recorded a strong July rally. As of the end of July 2026, ZAMA is trading at $0.06, up 50% over the previous week. Its market capitalization stands near $132 million, while daily trading volume has reached approximately $110 million, according to CoinMarketCap.
During the past 30 days, ZAMA traded between $0.02997 and $0.06602. Historical market data shows that the token more than doubled from its monthly low and recently approached a new all-time high.
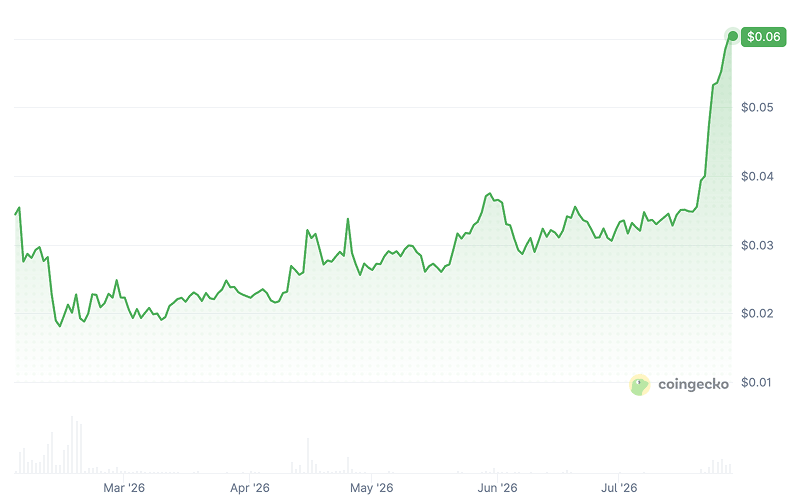
CoinGecko, July 28, 2026
This article examines short-term targets, Zama price prediction 2026 estimates, long-term projections through 2050, technical indicators and important price levels. So, let’s get started.
| Current ZAMA Price | ZAMA Price Prediction 2026 | ZAMA Price Prediction 2030 |
| $0.06 | $0.07 | $0.36 |
Article contents
- 1 Short-Term Zama Price Targets
- 2 Long-Term Zama Price Prediction 2026–2050
- 3 Zama Technical Analysis
- 4 Zama Key Price Levels
- 5 Popular Zama Moving Averages and Oscillators for July 2026
- 6 Zama Price Correlation
- 7 Is ZAMA a Good Investment?
- 8 What Is the Future Price of Zama?
- 9 Zama Price Prediction FAQ
- 9.1 What Is Zama’s Price Prediction Today?
- 9.2 What Is the Zama Price Prediction for This Week?
- 9.3 What Is the Zama Price Prediction for Next Week?
- 9.4 What Will the Price of Zama Be Next Month?
- 9.5 What Is the Zama Price Prediction for 2026?
- 9.6 What Is the Zama Price Prediction for 2027?
- 9.7 What Is the Zama Price Prediction for 2030?
- 9.8 Will Zama Reach $0.1?
- 9.9 Can Zama Reach $1?
- 9.10 Will ZAMA Go Up?
- 9.11 How High Can Zama Go?
- 9.12 What Affects the Price of Zama?
- 10 Where Can I Buy Zama Coin?
Short-Term Zama Price Targets
Current short-term Zama price forecasts vary considerably. Some models expect a correction after the recent rally, while others believe ZAMA could maintain its momentum or trade sideways.
The CoinCodex ZAMA forecast expects the token to trade between $0.05037 and $0.05324 during August 2026, with an average of $0.05184. These values represent changes of -20%, -16% and -18%, respectively. Its 30-day target stands at $0.04987, or -21%, while the six-month estimate is $0.05368, or -15%.
CoinCodex also projects a December range of $0.05016–$0.05042, with an average near $0.05027. That would place ZAMA approximately 21% below its current price by the end of 2026.
The MEXC prediction model presents a much more stable scenario. It estimates a 30-day price of $0.063379, almost unchanged from the current level. Its December forecast ranges from $0.057981 to $0.070866, with an average of $0.064424 and a potential change of +2%.
A more bullish CoinDCX analysis targets $0.062–$0.069 for August. Its model places the December target at $0.115, which would represent an 80% gain. In contrast, Binance’s aggregated August forecast ranges from $0.0372 to $0.0574, with an average of $0.0473.
These differences show why short-term Zama price predictions should not be treated as firm targets. A loss of key support, falling trading volume, new token supply or weakness in Bitcoin could invalidate bullish forecasts. Strong protocol announcements, higher adoption or sustained buying volume could invalidate the bearish models.
Long-Term Zama Price Prediction 2026–2050
Long-term cryptocurrency forecasts become less reliable with every additional year. ZAMA’s limited price history, changing supply and developing use case make distant projections especially uncertain.
| Year | Minimum Price | Maximum Price | Average Price | Price Change |
| 2026 | $0.032 | $0.11 | $0.07 | +15% |
| 2027 | $0.05 | $0.22 | $0.13 | +115% |
| 2030 | $0.074 | $0.65 | $0.36 | +500% |
| 2040 | $0.12 | $2.5 | $1.3 | +2,050% |
| 2050 | $0.2 | $1.29 | $0.75 | +1,150% |
Zama Price Prediction 2026
CoinCodex expects ZAMA to trade between $0.0465 and $0.06347 in 2026, equal to changes of -25% and +5%. Its average annualized forecast stands at $0.05065, or -15%.
CoinDCX provides the widest 2026 range at $0.03170–$0.115. The lower value would mean a 50.07% decline, while the upper target would produce an 85% gain. MEXC offers a more conservative point estimate of $0.06312, or +5%.
The Kraken projection tool estimates approximately $0.061, which would place ZAMA 2% above its current price. Combining the source-level forecasts produces an average of $0.06203.
Zama Price Prediction 2027
The Zama price prediction 2027 range is considerably wider. CoinCodex models a yearly low of $0.05075 and a high of $0.1579, representing changes of -20% and +150%. Its monthly forecasts produce an average near $0.09156.
CoinDCX presents a range of $0.11–$0.22, with a central target of $0.16. This scenario implies gains of +75% to +250%. Binance’s monthly estimates range from $0.05828 to $0.12484 and average approximately $0.09156.
MEXC offers a lower point estimate of $0.066276, equal to a 10% gain, while Kraken’s $0.064 projection implies only +7%. The combined average is $0.09468, or +60%.
Reaching the higher targets would require continued ecosystem expansion, new applications and enough demand to absorb newly minted or unlocked ZAMA. Without these conditions, the conservative forecasts around $0.06–$0.09 may prove more achievable.
Zama Price Prediction 2030
CoinCodex places its 2030 range between $0.0786 and $0.167, with an average of approximately $0.1025. This corresponds to potential gains of +25% to +180%.
CoinDCX is considerably more optimistic. Its model projects $0.32–$0.65, with a central target of $0.48. The range would represent growth of +430% to +950%. Binance estimates $0.2431014, while MEXC and Kraken provide much lower targets of $0.076733 and $0.074.
The combined 2030 average is $0.19527, equal to a potential increase of +220%. This value reflects very different assumptions about Zama adoption.
Zama Price Prediction 2040
CoinCodex’s 2040 model ranges from $0.2245 to $0.3105, with an average of $0.26112. That represents potential growth of +270% to +400%.
CoinDCX offers a far more aggressive range of $1.2–$2.5, with a $1.8 central target. MEXC predicts $0.125, Kraken estimates $0.12 and Binance projects approximately $0.748.
These forecasts produce a combined average of $0.61, or +915%. However, the wide spread between $0.12 and $2.5 is more important than the average itself. It shows that the models do not share a common view of Zama’s future adoption or valuation.
Any 2040 prediction carries extreme uncertainty. By then, Zama’s technology could become an important part of public blockchain infrastructure, face replacement by a better solution or operate in a completely different regulatory environment.
Zama Price Prediction 2050
CoinCodex estimates that ZAMA could trade between $0.5911 and $0.8417 in 2050. Its monthly average is approximately $0.71722, implying a gain of +1,100%.
Binance presents a higher range of $1.22–$1.29, averaging around $1.25. These figures correspond to gains of +1,900% to +2б000%. MEXC offers a much lower point estimate of $0.2, equal to +235%.
The resulting combined average is $0.72365, or +1,050%. Even so, mathematical models cannot reliably predict technology, regulation, token economics or user demand decades in advance. The 2050 figures should be viewed as theoretical scenarios rather than dependable price targets.
Zama Technical Analysis
Zama technical analysis remains broadly bullish, with 21 indicators showing buy signals and five pointing toward a possible decline. However, several oscillators suggest that ZAMA has become heavily overbought following its recent rally.
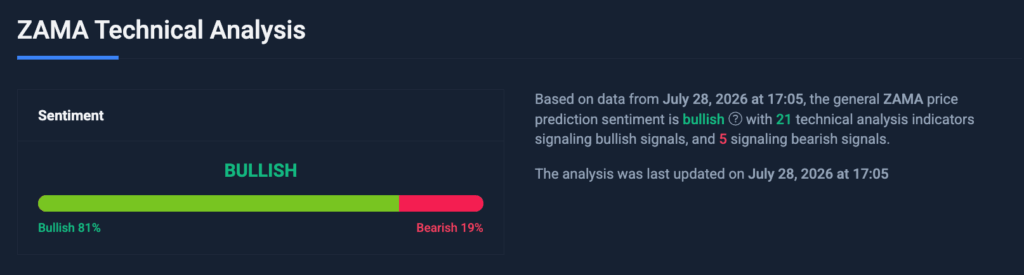
Coincodex, July 28, 2026
The 14-day RSI stands at 89.80. RSI measures price momentum on a scale from zero to 100, and a reading above 70 usually signals overheated market conditions. This does not guarantee a correction, but it suggests that the risk of profit-taking has increased.
MACD and the momentum indicator currently show neutral readings. Meanwhile, the ADX stands at 41.06, confirming that the existing trend has considerable strength.
Overall, the signals present a mixed short-term picture. Moving averages and trend indicators support the bullish outlook, while overbought oscillators warn that ZAMA may consolidate or experience a temporary pullback before making another sustained move.
Zama Key Price Levels
The current classical pivot is approximately $0.05969. Trading above this level keeps the immediate market structure constructive.
The main levels are:
- Immediate support: $0.0535
- Stronger support: $0.0467
- Deeper support: $0.04052
- Immediate resistance: $0.06648
- Stronger resistance: $0.07267
- Higher resistance: $0.07946
A confirmed break above $0.06648 could move ZAMA into price discovery and open the way toward $0.07267. However, a failed breakout could encourage profit-taking after the recent rally.
A drop below $0.0535 would weaken the short-term structure. In that situation, traders could begin watching $0.0467 as the next major support area. These are technical zones rather than exact reversal points.
Popular Zama Moving Averages and Oscillators for July 2026
| Indicator | Current Value | Signal |
| RSI (14) | 89.8 | Sell / Overbought |
| Stochastic RSI (14) | 100 | Sell / Overbought |
| Stochastic Fast (14) | 83.51 | Sell |
| CCI (20) | 161.85 | Sell / Overbought |
| ADX (14) | 41.06 | Buy / Strong Trend |
| Williams %R (14) | -16.49 | Sell / Overbought |
| MACD (12, 26) | 0 | Neutral |
| Momentum (10) | 0.03 | Neutral |
| 21-Day SMA | $0.04055 | Buy |
| 50-Day SMA | $0.03578 | Buy |
| 100-Day SMA | $0.03279 | Buy |
| 21-Day EMA | $0.04376 | Buy |
| 50-Day EMA | $0.03788 | Buy |
| 100-Day EMA | $0.03368 | Buy |
For beginners, the combined reading is straightforward. ZAMA trades well above its major moving averages, which supports the broader uptrend. At the same time, RSI, Stochastic RSI, CCI, and Williams %R indicate an overstretched market that could consolidate or pull back.
Zama Price Correlation
ZAMA has recently behaved more like a project-specific momentum token than a typical large-cap cryptocurrency. Over seven days, its correlation with the top ten cryptocurrencies excluding stablecoins was -0.43, while its correlation with the wider top-100 market was -0.491.
ZAMA also gained substantial value against both Bitcoin and Ethereum, showing relative outperformance rather than proving a permanent negative correlation. Its strongest measured positive relationship was with infrastructure token LayerZero at 0.678. Correlations can change quickly during market stress, exchange listings, token unlocks or major Zama announcements.
Is ZAMA a Good Investment?
ZAMA offers exposure to a clear use case: confidential applications on public blockchains. Zama’s technology allows smart contracts to work with encrypted information, which could support private payments, trading, payroll, decentralized finance and real-world asset tokenization.
The token also has active markets and relatively high daily volume compared with its $132 million market capitalization. However, liquidity can fall quickly when interest in a smaller cryptocurrency declines.
Supply presents another risk. Approximately 2.2 billion ZAMA circulate, while the reported total supply has risen above 11 billion. The Zama Protocol litepaper describes a burn-and-mint model: protocol fees are burned, while new tokens reward operators and stakers. This means ZAMA has no dependable fixed maximum supply.
ZAMA may appeal to investors who understand early-stage infrastructure projects and can tolerate severe volatility. It may be unsuitable for risk-averse beginners. Price forecasts remain speculative, so readers should examine adoption, token issuance, competition and regulation before reaching their own conclusions.
What Is the Future Price of Zama?
The short-term ZAMA price forecast ranges from approximately $0.037 to $0.069 for August 2026, depending on the model. The combined 2026 range is $0.032–$0.115, while the 2030 range expands to $0.074–$0.65.
The bullish scenario requires Zama to become a widely used confidentiality layer for public blockchains. Higher confidential transaction volume, successful institutional applications and fee-driven token burns could move ZAMA toward the upper estimates. The recently introduced confidential RFQ system, which uses swap fees to buy back and burn ZAMA, is one potential demand driver.
The bearish scenario involves limited usage, excessive token issuance, weaker liquidity, regulatory restrictions or stronger competing technologies. Under those conditions, ZAMA could remain near the lower end of the forecast ranges.
Zama Price Prediction FAQ
What Is Zama’s Price Prediction Today?
ZAMA’s trend remains bullish but overheated. A cautious daily range is $0.0597–$0.0665. RSI near 90 warns that a pullback can occur even while moving averages continue to support the uptrend.
What Is the Zama Price Prediction for This Week?
The most defensible model-based range for this week is $0.04896–$0.06347. Holding the $0.0535 support area would favor stabilization, while a break above $0.0665 would reopen price discovery.
What Is the Zama Price Prediction for Next Week?
CoinCodex places next week’s range at $0.04896–$0.05142. A stronger-than-expected hold above $0.0535 or a fresh project catalyst could invalidate this cautious forecast and lift the range.
What Will the Price of Zama Be Next Month?
For August 2026, CoinCodex projects $0.05037–$0.05324, averaging $0.05184. Other models range from bearish to mildly bullish, so $0.04987 is the clearest 30-day reference target.
What Is the Zama Price Prediction for 2026?
The combined 2026 Zama price forecast spans $0.0317–$0.1150, with a cross-source average of $0.06203. That average equals a -2.30% change from the current $0.06349 price.
What Is the Zama Price Prediction for 2027?
The combined 2027 range is $0.05075–$0.2200, while the average of source-level forecasts is $0.09468. That would represent a +49.12% change from the current ZAMA price.
What Is the Zama Price Prediction for 2030?
For 2030, the combined forecast range is $0.0786–$0.65, with a source-level average of $0.19527. This implies a +207% change, but the spread shows how uncertain long-term models are.
Will Zama Reach $0.1?
ZAMA needs a +57.51% gain from $0.06349 to reach $0.10. With 2.2 billion tokens circulating, that price implies a $220 million market cap and about $1.12 billion on today’s total supply.
Can Zama Reach $1?
ZAMA needs a +1,475% gain to reach $1. At today’s supply, that implies a $2.2 billion circulating market cap and roughly $11.19 billion on total supply, before future minting or burns.
Will ZAMA Go Up?
ZAMA can rise if adoption, confidential transaction volume, exchange liquidity and fee burns grow while Bitcoin and the wider market stay supportive. Unlocks, inflation or weaker demand could reverse the move.
How High Can Zama Go?
The highest range used here is CoinDCX’s speculative $2.5 maximum for 2040. It is not a dependable target: adoption, competition, regulation and ZAMA’s changing supply could produce a far lower outcome.
What Affects the Price of Zama?
ZAMA reacts to protocol adoption, token supply, unlocks, exchange listings, Bitcoin’s direction, liquidity, regulation, development progress and investor sentiment. Project-specific announcements can dominate briefly.
Where Can I Buy Zama Coin?
ZAMA is available on several established cryptocurrency exchanges. CoinGecko identifies Binance as its most active market, while Gate and OKX are also among the main trading options.
For users seeking a simpler alternative, StealthEX may be the better option. This non-custodial swap service generally allows users to obtain ZAMA without creating an account or completing routine KYC.
Before making a transaction, verify the token contract, blockchain network, liquidity and wallet compatibility. The Ethereum ZAMA contract is 0xa12cc123ba206d4031d1c7f6223d1c2ec249f4f3. Using the wrong network or an incompatible address could result in permanent loss.
How to Buy Zama: Quick-Step Guide
ZAMA is currently available through StealthEX, although users should verify the desired pair and network before starting the exchange.
- Choose a supported cryptocurrency pair, such as ETH to ZAMA
- Enter the amount you want to exchange.
- Enter a compatible ZAMA crypto wallet address.
- Send the funds to the provided deposit address.
- Wait for the transaction to complete and receive ZAMA in your wallet.

The whole process usually takes only a few minutes. You keep full control over your funds at all times.
Follow us on Medium, X, Telegram, YouTube, and Publish0x to stay updated about the latest news on StealthEX.io and the rest of the crypto world.
Don’t forget to do your own research before buying any crypto. The views and opinions expressed in this article are solely those of the author.
crypto price prediction how to buy crypto price analysis price prediction ZAMARecent Articles on Cryptocurrency