Cash Cat Price Prediction 2026, 2027-2030


Cash Cat price predictions remain unusually wide because CASHCAT is a young meme coin whose value depends heavily on attention, listings, and liquidity. As of October 21, 2026, the current price was $0.12. During the previous 30 days, CASHCAT traded between $0.0978 and $0.2023, showing both explosive upside and severe volatility.
At the moment of writing, the token was up 12% over 24 hours and up roughly 4% across seven days. Its market capitalization was about $118.02 million, while 24-hour volume reached $21.8 million. The tracker-reported fully diluted valuation was also $118.02 million. However, valuing the maximum supply at the current price produces a $1B maximum-supply valuation. CoinGecko estimated 1B tokens in circulation after burns, against a maximum supply of 1 billion.
This Cash Cat price prediction reviews short- and long-term targets, technical indicators, key levels, correlations, valuation scenarios and risks. Forecast confidence remains low because CASHCAT has a short history and limited order-book depth.
| Current CASHCAT Coin Price | CASHCAT Price Prediction 2026 | CASHCAT Price Prediction 2030 |
| $0.12 | $0.123 | $0.239 |
Article contents
- 1 Short-Term Cash Cat Price Targets
- 2 Long-Term Cash Cat Prediction 2026–2050
- 3 Cash Cat Technical Analysis
- 4 CASHCAT Key Price Levels
- 5 Popular Cash Cat Oscillators
- 6 Cash Cat Correlation
- 7 Is CASHCAT a Good Investment?
- 8 Can Cash Cat Reach $1, $10, or $100?
- 9 Cash Cat Price Prediction FAQ
- 9.1 What Is CASHCAT’s Price Prediction Today?
- 9.2 What Is the Cash Cat Price Prediction for This Week?
- 9.3 What Is the Cash Cat Price Prediction for Next Week?
- 9.4 What Will the Price of Cash Cat Be Next Month?
- 9.5 What Is the CASHCAT Price Prediction for 2026?
- 9.6 What Is the Cash Cat Price Prediction for 2027?
- 9.7 What Is the Cash Cat Price Prediction for 2030?
- 9.8 Will Cash Cat Reach $1?
- 9.9 Will Cash Cat Reach $10?
- 9.10 Will Cash Cat Reach $100?
- 9.11 Is CASHCAT a Good Buy in 2026?
- 9.12 Will Cash Cat Go Up?
- 9.13 How High Can Cash Cat Go?
- 9.14 Is CASHCAT a Good Investment?
- 9.15 What Affects the Price of Cash Cat?
- 10 How to Buy Cash Cat (CASHCAT): Quick-Step Guide
Short-Term Cash Cat Price Targets
The latest CoinCodex forecast expects CASHCAT to reach $0.08858 within one month and approximately $0.09688 in six months. Its calendar-month estimates place November 2026 between $0.08969 and $0.09593, with a $0.09281 average.
The 3Commas projection is more optimistic for November and December but shows a wider downside range in 2027. Its November range is $0.10442305 to $0.11781004, while its December band extends from $0.13113676 to $0.13587977.
The following table uses the lowest minimum, highest maximum, and mean of the available source averages or range midpoints.
| Forecast Period | Minimum Price | Maximum Price | Average Price | Change From Current Price |
| November 2026 | $0.08969 | $0.11781 | $0.10375 | -14% |
| December 2026 | $ 0.09287 | $0.13588 | $0.11437 | -5% |
| April 2027 | $ 0.09193 | $0.114123 | $0.10303 | -15% |
The short-term Cash Cat price forecast therefore leans slightly bearish. November’s combined average sits below the current price, while the December average indicates near-flat performance.
The large differences between sources reflect CASHCAT’s short trading history. A new listing, whale transaction, Robinhood Chain announcement, or meme-coin rotation could quickly invalidate these projections. Conversely, declining volume or a broader market sell-off could push the price below the forecast ranges.
Long-Term Cash Cat Prediction 2026–2050
Long-term cryptocurrency forecasts are speculative, particularly for a meme coin without established utility or a long operating history. Small changes in model assumptions can produce dramatically different results over 10 or 20 years.
The table combines CoinCodex and 3Commas estimates with the experimental ranges published by CoinDataFlow. It also includes MEXC’s mechanical 5% growth scenario, which is a mathematical illustration rather than a market-based prediction.
| Year | Minimum Price | Maximum Price | Average Price | Price Change |
| 2026 | $0.081 | $0.123 | $0.111 | -7% |
| 2027 | $0.08 | $0.132 | $0.106 | -12% |
| 2030 | $0.095 | $0.239 | $0.148 | +23% |
| 2040 | $0.238 | $0.688 | $0.404 | +237% |
| 2050 | $0.387 | $1.81 | $1.1 | +910% |
Cash Cat Price Prediction 2026
CoinCodex’s model points lower for the rest of 2026. It puts CASHCAT between $0.0814 and $0.117, or -32% to -2% from the current price. Its annualized average is $0.0924 (-23%), and its year-end target is $0.092. Overall sentiment on the site is neutral, but the short-term model is bearish and expects a drop of about 25% over the next month.
The 3Commas forecast for November–December is flat, at $0.1198 to $0.1232. That is -0.2% to +3%, with an average of $0.1215 (+1%). MEXC’s fixed 5% growth calculator starts from today’s price, so its 2026 figure is $0.12, with no change.
That makes the combined Cash Cat price prediction 2026 range $0.081 to $0.123, with a $0.111 average (-7%). To hold near the top of the range, CASHCAT would need renewed meme-coin demand, more activity on Robinhood Chain, deeper liquidity, and a supportive Bitcoin market.
Cash Cat Price Prediction 2027
CoinCodex’s monthly forecasts give a 2027 range of $0.08 to $0.325, or -33% to +170%. The high point comes in August. Its monthly averages work out to an annual average of $0.158 (+32%).
The 3Commas estimate is much more conservative at $0.09 to $0.132, or -25% to +10%, with an average of $0.111 (-8%). MEXC’s 5% scenario gives $0.126, a 5% increase.
The combined 2027 average is $0.132, which implies a 10% gain. Reaching the upper part of the range would require continued exchange access, growing community activity, deeper liquidity, and ongoing interest in Robinhood Chain. Weak demand or fading social attention could keep CASHCAT near the lower estimates.
Cash Cat Price Prediction 2030
CoinCodex projects CASHCAT between $0.138 and $0.239 in 2030. That means gains of 15% to 100%. Its annual average is $0.179 (+49%).
3Commas is more bearish, with a range of $0.095 to $0.142, or -21% to +19%, and an average of $0.119 (-1%). MEXC’s fixed-growth result is $0.146, or +22%.
Together, these forecasts give a combined average of $0.148 (+23%) and a range of $0.095 to $0.239. One model sees the price roughly doubling, and another sees it slightly below today’s level. That spread shows how unreliable a Cash Cat price prediction 2030 still is. CASHCAT would need to keep its community, exchange listings, liquidity, and relevance for several years while competing with thousands of other meme coins.
Cash Cat Price Prediction 2040
Only CoinCodex and MEXC offer projections for 2040. CoinCodex’s monthly model gives a range of $0.467 to $0.688, or gains of 290% to 473%. Its average is about $0.57 (+375%). MEXC’s simple 5% annual growth scenario gives $0.238, a 98% increase.
Combined, the two sources give a $0.404 average (+237%) and a wide $0.238 to $0.688 range.
For either projection to matter, Cash Cat would need to survive for more than a decade, keep active markets, and avoid being abandoned or delisted. No model can reliably say whether the token, Robinhood Chain, or its meme narrative will still be popular that far ahead.
Cash Cat Price Prediction 2050
CoinCodex’s 2050 monthly estimates range from $1.27 to $1.81, or gains of 958% to 1,408%. The annual average is about $1.56 (+1,204%), and the year-end target is $1.50.
MEXC’s fixed 5% scenario is much lower at $0.387, though that is still a 223% increase. The two sources together give a combined average of $0.976 (+713%).
The resulting $0.387 to $1.81 range should not be read as a reliable Cash Cat future price. No algorithm can accurately predict project survival, regulation, token economics, technology changes, exchange access, or investor demand 24 years out.
Cash Cat Technical Analysis
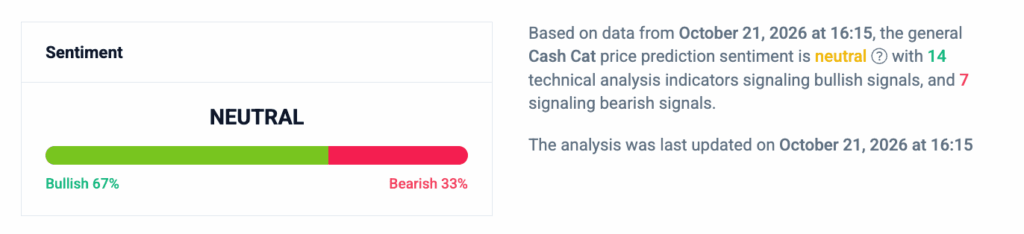
According to CoinCodex data from October 2026, the overall Cash Cat technical analysis signal was neutral.
CoinCodex, October 21, 2026
Approximately 67% of the tracked indicators were bullish, while 33% were bearish. 14 indicators produced bullish signals and 7 produced bearish signals.
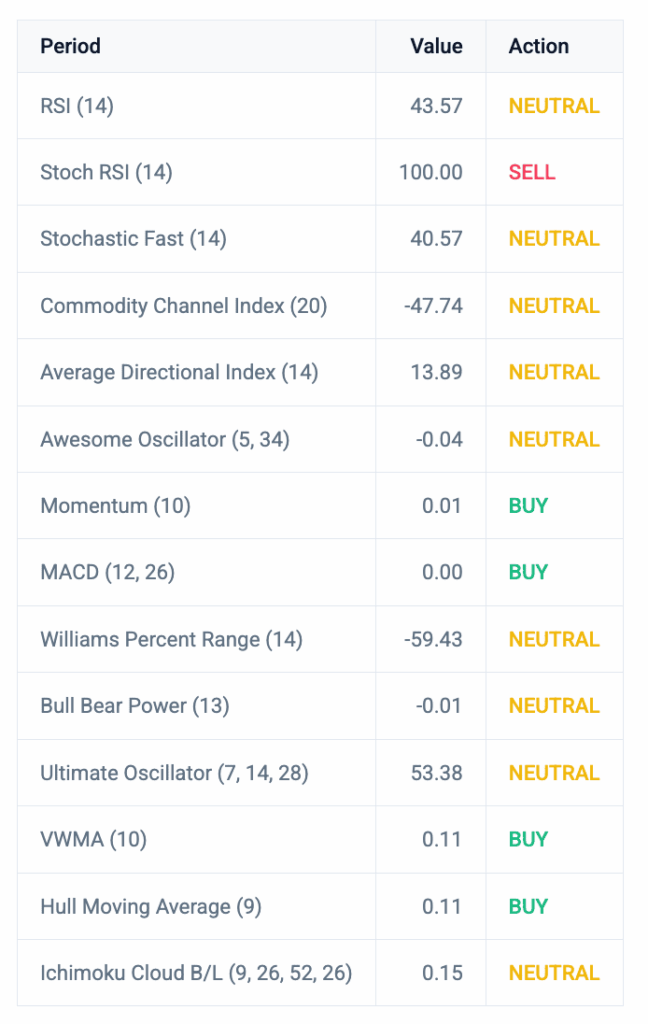
RSI stood at 43.57. The Relative Strength Index measures recent buying and selling momentum on a scale from zero to 100. A reading near 50 indicates neutral conditions rather than an overbought or oversold market.
MACD and ten-period momentum both displayed 0.00, providing little directional information. ADX reached 13.89, indicating a neutral trend.
The indicators provided signals that were not overly contradictory, while moving averages pointed to a potential decline in prices. CASHCAT traded below most short-term exponential moving averages and its three-, five-, and ten-day simple moving averages. Low liquidity and CASHCAT’s short trading history may reduce the reliability of these signals.
CASHCAT Key Price Levels
CoinCodex reported the following classical pivot levels:
| Level | Price | Interpretation |
| Strongest Support | $ 0.08725 | Major downside reference |
| Strong Support | $ 0.0953 | Secondary buyer zone |
| Immediate Support | $ 0.1062 | First major downside level |
| Pivot | $0.1142 | Short-term directional threshold |
| Immediate Resistance | $ 0.1251 | First breakout level |
| Strong Resistance | $ 0.1331 | Secondary upside barrier |
| Higher Resistance | $ 0.144 | Major recovery target |
CASHCAT was trading above the $0.1142 pivot and the immediate resistance. A sustained move above $ 0.1251 and $0.1331 could open a path toward $ 0.144. A decline below $ 0.1062 would increase the risk of testing $ 0.0953 and $ 0.08725.
Recent price action also makes $0.12 an important psychological level, although it is an inferred market level rather than a reported pivot. Any breakout or breakdown needs increasing volume. In a thin market, one large transaction can briefly move the price through a technical level without establishing a lasting trend.
Popular Cash Cat Oscillators
CoinCodex, October 21, 2026
For a beginner, the combined picture suggests neutral momentum inside a weak short-term price trend. The oversold Stochastic RSI allows for a rebound, but most available moving averages still act as overhead resistance.
Cash Cat Correlation
CoinCodex measured CASHCAT’s correlation with the ten largest non-stablecoin cryptocurrencies at 0.578. Its correlation with the top 100 non-stablecoins was weaker at 0.552. This indicates a link to the broader market, though the correlation is not strong.
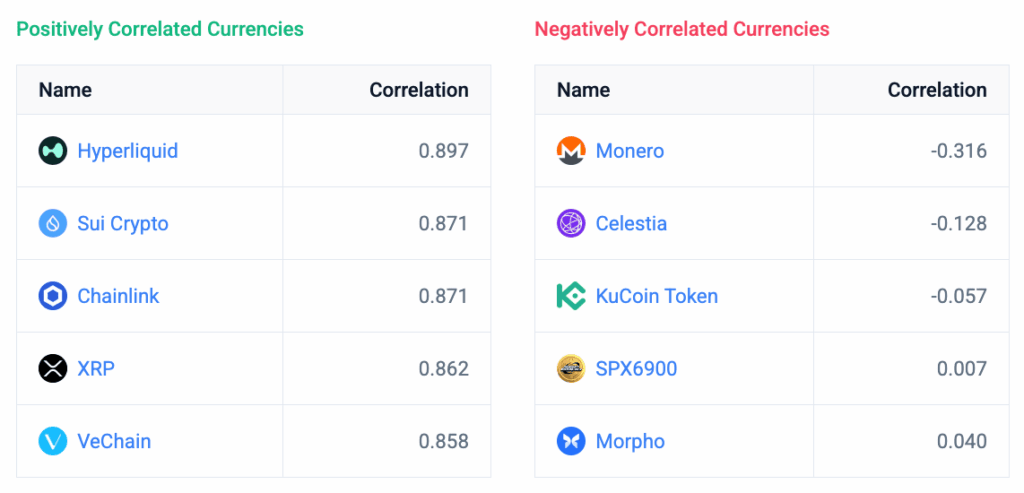
CoinCodex, October 21, 2026
No reliable public coefficients specifically measuring CASHCAT against Bitcoin or Ethereum were available. Observationally, CASHCAT fell roughly 4% in seven days while the global crypto market remained nearly flat and the meme category declined about 1%. This shows that token-specific flows can dominate broader market direction.
Bitcoin and Ethereum rallies can still increase risk appetite for CASHCAT and comparable meme coins. During market stress, liquidity usually moves toward larger assets. Correlations can also change after Cash Cat announcements, burns, whale transfers, listings, sharp liquidity changes, or other project-specific events.
Is CASHCAT a Good Investment?
CASHCAT’s main advantage is its recognizable narrative. The token refers to Robinhood’s original working name and trades natively on Robinhood Chain. The official Cash Cat website identifies a 1 billion initial supply, a burned liquidity position, and no transaction tax.
However, the website also states that the token has zero promised utility and is not affiliated with Robinhood Markets or Vlad Tenev. Its roadmap is intentionally presented as a meme rather than a formal development plan. CASHCAT therefore depends mainly on cultural relevance, community activity, listings, and speculative demand.
One important development is that CASHCAT is now tradable through Robinhood. It also has markets on KuCoin, MEXC, Uniswap, and several smaller platforms. Meanwhile, Robinhood Chain’s expanding on-chain activity could bring more traders and capital into its ecosystem.
These advantages do not remove the risks. Individual order books remain relatively thin compared with headline trading volume. Large holders can cause abrupt movements, while bridge failures, network issues, contract risks, competition, regulation, delistings, and fading community attention could reduce demand. CASHCAT remains a high-risk speculative asset rather than a utility-based investment.
Can Cash Cat Reach $1, $10, or $100?
These calculations use the current price of about $0.12 and a circulating supply of 1 billion tokens. That matches the 1 billion maximum supply, so the circulating market cap and the fully diluted valuation (FDV) are the same. At today’s price, Cash Cat’s market cap is about $118 million.
| Target Price | Required Gain | Market Cap / FDV | Multiple of Current Valuation |
|---|---|---|---|
| $1 | +733% | $1 billion | ~8.3x |
| $10 | +8,233% | $10 billion | ~83x |
| $100 | +83,233% | $100 billion | ~833x |
A $1 CASHCAT price would require more than eight times the current valuation, taking the market cap from about $120 million to $1 billion. That is ambitious, but a successful meme coin can do it. It would need much more liquidity, wider exchange access, steady community demand, and relevance over the long term.
At $10, Cash Cat would be worth $10 billion and become one of the largest meme coins on the market. That looks highly unlikely without a major change in its utility, adoption, or token economics.
A $100 price would mean a $100 billion valuation. That would be about 3.5% of the whole crypto market, which is currently around $2.8–2.9 trillion. Under current conditions, this target looks extremely remote.
Cash Cat Price Prediction FAQ
What Is CASHCAT’s Price Prediction Today?
The near-term outlook is neutral to bearish. CASHCAT may trade between $0.093 and $0.12 today, a move of -23% to 0%. Key levels are support at $0.1025 and resistance at $0.1206. Thin liquidity and sudden spikes in trading volume can push it outside that range.
What Is the Cash Cat Price Prediction for This Week?
This week’s combined model range is $0.087 to $0.127, or -27% to +6%. Holding the $0.10 area would improve the setup. A break below it with strong volume could open the way to $0.087–$0.09.
What Is the Cash Cat Price Prediction for Next Week?
CoinCodex expects a narrow range next week of $0.089 to $0.09, or -26% to -25%. A Bitcoin recovery, stronger demand for meme coins, or new trading volume from exchanges could lift CASHCAT above that band.
What Will the Price of Cash Cat Be Next Month?
For November 2026, the combined range is $0.089 to $0.122, with an average of $0.106. That average is an 11% drop from the current price.
What Is the CASHCAT Price Prediction for 2026?
The combined 2026 range is $0.081 to $0.123, with an average of $0.111. That is a 7% drop from the current price.
What Is the Cash Cat Price Prediction for 2027?
The combined 2027 range is $0.08 to $0.325, with an average of $0.132. The average points to a 10% rise, but the very wide range means the forecasts carry little certainty.
What Is the Cash Cat Price Prediction for 2030?
The combined 2030 range is $0.095 to $0.239, with an average of $0.148. That is a 23% rise from the current price. The $0.239 high comes from CoinCodex alone and is an outlier.
Will Cash Cat Reach $1?
Cash Cat needs to rise 733% to reach $1. With 1 billion tokens in circulation, that means a $1 billion market cap, about 8.3 times today’s $120 million.
Will Cash Cat Reach $10?
Cash Cat needs to rise 8,233% to reach $10. That means a $10 billion market cap, about 83 times today’s, which looks highly unlikely right now.
Will Cash Cat Reach $100?
Cash Cat needs to rise 83,233% to reach $100. That means a $100 billion market cap, about 833 times today’s, which makes the target extremely remote.
Is CASHCAT a Good Buy in 2026?
CASHCAT offers meme-driven upside but has no promised utility, a short history, volatile liquidity, and high sentiment risk. Its 2026 appeal depends on listings, demand, and Robinhood Chain activity.
Will Cash Cat Go Up?
CASHCAT can rise if demand, liquidity, exchange access, community growth, and Robinhood Chain adoption improve. Sustainable gains also need supportive Bitcoin and altcoin market conditions.
How High Can Cash Cat Go?
The highest forecast in the long-term is $1.8 for 2050. Reaching that level would require sustained demand, deep liquidity, continued exchange access, and long-term community interest. It remains highly speculative.
Is CASHCAT a Good Investment?
CASHCAT may appeal to high-risk meme-coin traders because of its brand narrative and listings. However, volatility, thin depth, whale concentration, execution, competition, and regulatory risks remain high.
What Affects the Price of Cash Cat?
CASHCAT responds to adoption, utility expectations, supply, whale activity, listings, liquidity, Bitcoin, regulation, development, community interest, sentiment, and Robinhood Chain-specific events.
How to Buy Cash Cat (CASHCAT): Quick-Step Guide
You can exchange cryptocurrency for CASHCAT without creating an account through platforms such as StealthEX. The service currently supports the correct Cash Cat token on Robinhood Chain and sends the purchased tokens directly to your wallet.
Just follow these simple steps:
- Choose a supported crypto pair, for example ETH to CASHCAT.
- Enter the amount you want to exchange.
- Enter a wallet address that supports Cash Cat.
- Send funds to the provided deposit address.
- Receive CASHCAT directly in your wallet.
That’s it. The process takes only a few minutes and does not require registration.
Always confirm the blockchain network and token contract. Similarly named tokens exist on other networks, and using the wrong address or blockchain can result in permanent loss.
Follow us on Medium, X, Telegram, YouTube, and Publish0x to stay updated about the latest news on StealthEX.io and the rest of the crypto world.
Don’t forget to do your own research before buying any crypto. The views and opinions expressed in this article are solely those of the author.
Cash Cat CASHCAT crypto price prediction price analysis price predictionRecent Articles on Cryptocurrency