Rain (RAIN) Price Prediction 2026, 2027-2030



Rain is a decentralized prediction market on Arbitrum where anyone can create a market on a future event and trade on its outcome, and RAIN is the token behind the protocol. This Rain price prediction looks at whether the project can recover after a large token unlock pushed the price down sharply. RAIN currently trades at $0.006764, near the bottom of its 30-day range of $0.006741 to $0.0134.
RAIN has fallen 6% in 24 hours, 24.8% over seven days and 45.5% over 30 days, although it is still about 123% higher than a year ago. According to CoinGecko, Rain’s market capitalization is about $4.81 billion, ranking it 22nd among cryptocurrencies, while 24-hour trading volume is only about $12.4 million. Around 710.8 billion RAIN are in circulation out of a maximum supply of 1.15 trillion. The token peaked at $0.0195 on August 25, 2026, and now trades about 65% below that high.
Supply has been the main story this month. A scheduled unlock on October 12 lifted the circulating share to about 62% of all issued tokens, and most of the price drop came in the weeks before the release, as CryptoTicker noted. Estimates of the unlock’s value ranged from about $417 million to $785 million. Access has also narrowed: Kraken delisted RAIN, disabling trading in June and liquidating remaining balances in September. On the product side, Rain is preparing its V2 upgrade, with an on-chain order book and AI-assisted market creation and resolution. Below, we compare forecasts for the next month, six months and year-end, look at long-term scenarios to 2050, and review the monthly technical signals, key levels and correlation with Bitcoin and Ethereum.
| Current RAIN Price | RAIN Price Prediction 2026 | RAIN Price Prediction 2030 |
|---|---|---|
| $0.006764 | $0.0308 | $0.053 |
Article contents
- 1 Short-Term Rain Price Targets (month, half-year, end of year)
- 2 Long-Term Rain Prediction (2026-2050)
- 3 Rain Technical Analysis
- 4 RAIN Key Price Levels
- 5 Popular Rain Moving Averages and Oscillators
- 6 Correlation
- 7 Is Rain a Good Investment?
- 8 Rain Price Prediction FAQ
- 8.1 What Is RAIN’s Price Prediction Today?
- 8.2 What Is the Rain Price Prediction for This Week?
- 8.3 What Is the Rain Price Prediction for Next Week?
- 8.4 What Will the Price of Rain be Next Month?
- 8.5 What Is the RAIN Price Prediction for 2026?
- 8.6 What Is the Rain Price Prediction for 2027?
- 8.7 What Is the Rain Coin Price Prediction for 2030?
- 8.8 Will Rain Reach $0.1?
- 8.9 Will Rain Reach $1?
- 8.10 How High Can Rain Go?
- 8.11 What Is the Future of Rain?
- 8.12 Is Rain Crypto Safe?
- 8.13 What Affects the Price of Rain?
- 9 How to Buy Rain Crypto: Quick-Step Guide
Short-Term Rain Price Targets (month, half-year, end of year)
The following outlook uses RAIN price predictions from CoinCodex and PricePrediction.net.
CoinCodex is bearish over the next few days. It sees RAIN near $0.006902 on October 29, about 2% above the current price, before a slide to $0.005301 by November 2, about 22% below it.
For this week, CoinCodex expects RAIN to trade between $0.005441 and $0.006902, and for next week between $0.005085 and $0.005441, or 20% to 25% below the current price. Its daily RSI (14) of 28.87 is already in oversold territory, and its 50-day SMA of $0.01155 and 200-day SMA of $0.01216 sit far above the current price, which shows how much ground RAIN has lost.
| Period | Minimum Price | Average Price | Maximum Price | Change From Current Price |
|---|---|---|---|---|
| Next Month: November 2026 | $0.005236 | $0.00926 | $0.0152 | +37% |
| In Six Months: April 2027 | $0.005242 | $0.0271 | $0.0529 | +301% |
| End of Year 2026 | $0.004821 | $0.0308 | $0.0621 | +355% |
The table summarises short-term forecasts from CoinCodex and PricePrediction.net.
The two sources tell very different stories. CoinCodex keeps RAIN between $0.005236 and $0.005601 in November, below today’s price, while PricePrediction.net expects $0.0103 to $0.0152. For April 2027, CoinCodex sees $0.005242 to $0.005656, compared with $0.0447 to $0.0529 from PricePrediction.net.
The year-end figures need extra caution. CoinCodex targets $0.005558 (-18%) by the end of 2026, while PricePrediction.net’s model jumps from about $0.0131 in November to a range of $0.05 to $0.0621 by the end of the year, a roughly fourfold move in a single month. That outlier lifts the combined 2026 average well above what the recent trend supports.
Long-Term Rain Prediction (2026-2050)
CoinCodex and PricePrediction.net both expect RAIN to trade higher over the long term, but PricePrediction.net’s targets are several times higher every year. The table below summarises their forecasts. These are model-generated estimates, not guaranteed outcomes.
| Year | Minimum Price | Maximum Price | Average Price | Price Change |
|---|---|---|---|---|
| 2026 | $0.004821 | $0.0621 | $0.0308 | +355% |
| 2027 | $0.004743 | $0.0291 | $0.018 | +167% |
| 2028 | $0.006533 | $0.0696 | $0.0373 | +451% |
| 2029 | $0.006519 | $0.1932 | $0.0898 | +1,228% |
| 2030 | $0.008096 | $0.1048 | $0.053 | +684% |
| 2035 | $0.0151 | $0.4255 | $0.2131 | +3,051% |
| 2040 | $0.0261 | $0.5129 | $0.239 | +3,433% |
| 2050 | $0.0686 | $0.5952 | $0.3011 | +4,351% |
CoinCodex supplies every minimum and PricePrediction.net every maximum, so the averages sit in a wide gap between the two. The 2029 row stands out because PricePrediction.net’s model peaks that year and then pulls back in 2030.
Rain Price Prediction 2026
CoinCodex expects RAIN to trade between $0.004821 (-29%) and $0.006902 (+2%) for the rest of 2026, with an average of $0.005484.
PricePrediction.net sees $0.05 (+639%) to $0.0621 (+818%), with an average of $0.0561. Reaching that range would require RAIN to more than double its all-time high within weeks.
Rain Price Prediction 2027
CoinCodex forecasts $0.004743 (-30%) to $0.0189 (+180%) for 2027, with an average of $0.009154.
PricePrediction.net’s range is $0.0246 (+264%) to $0.0291 (+330%), with an average of $0.0269.
More unlocks are a key factor. Roughly 38% of the issued supply was still locked after the October release, and every new tranche adds tokens that the market has to absorb.
Rain Price Prediction 2028
CoinCodex expects $0.006533 (-3%) to $0.0127 (+88%) in 2028, with an average of $0.01.
PricePrediction.net sees $0.0595 (+780%) to $0.0696 (+929%), with an average of $0.0645.
CoinCodex’s entire 2028 range stays below the August peak of $0.0195, while PricePrediction.net’s whole range sits more than three times above it. For RAIN to reach the higher band, trading activity on the platform would likely need to grow far beyond current levels.
Rain Price Prediction 2029
CoinCodex forecasts $0.006519 (-4%) to $0.009759 (+44%) for 2029, while PricePrediction.net sees $0.1518 (+2,144%) to $0.1932 (+2,756%).
These projections do not establish a predetermined market cycle. Demand for prediction markets, competition from larger platforms, regulation and wider market conditions could produce very different results.
Rain Coin Price Prediction 2030
CoinCodex places RAIN between $0.008096 (+20%) and $0.014 (+107%) in 2030, with a year-end target of $0.0124.
PricePrediction.net’s range is $0.0865 (+1,179%) to $0.1048 (+1,449%), with an average of $0.0957.
The gap between the sources is especially clear here: PricePrediction.net’s minimum is about six times CoinCodex’s maximum. A realistic view probably lies somewhere between the two, depending on how much of the locked supply reaches the market by then.
Rain Price Prediction 2035
CoinCodex forecasts $0.0151 (+123%) to $0.0389 (+474%) for 2035, while PricePrediction.net sees $0.3819 (+5,546%) to $0.4255 (+6,191%).
Rain Price Prediction 2040
CoinCodex projects $0.0261 (+285%) to $0.0384 (+467%) for 2040, with a year-end target of $0.0269. PricePrediction.net’s range is $0.3791 (+5,505%) to $0.5129 (+7,483%).
Rain Price Prediction 2050
CoinCodex estimates $0.0686 (+915%) to $0.0977 (+1,345%) for 2050, with an average of $0.0845, and its path peaks at $0.1479 in 2047. PricePrediction.net’s range is $0.44 (+6,405%) to $0.5952 (+8,700%).
With a maximum supply of 1.15 trillion tokens, $0.5952 would value RAIN at roughly $684 billion. These forecasts are highly theoretical, and no forecast establishes how high RAIN will actually trade.
Rain Technical Analysis
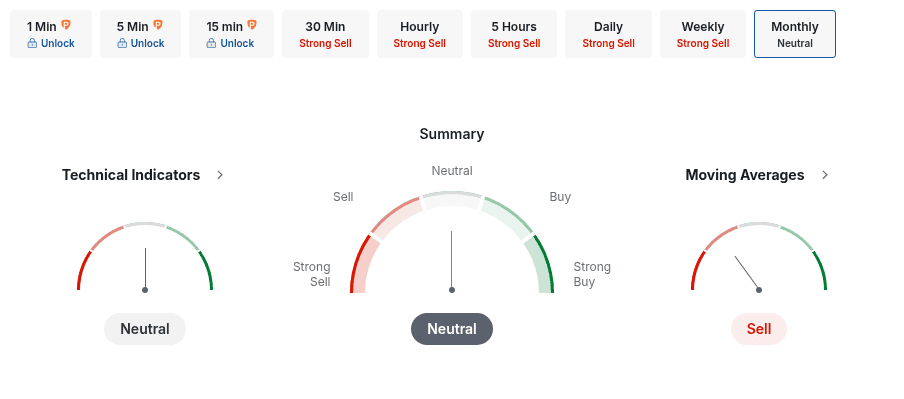
Investing.com gives RAIN an overall Neutral rating on the monthly timeframe. Within that summary, technical indicators signal Neutral (1 buy, 1 neutral, 0 sell), while moving averages signal Sell (0 buy, 4 sell).
Investing
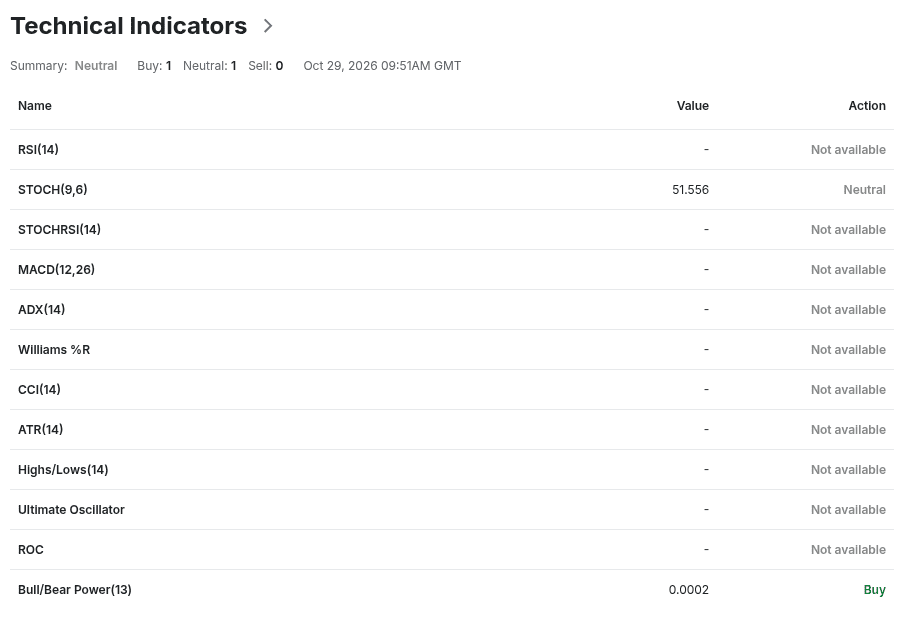
RAIN has only about a year of monthly candles, so Investing.com does not yet show a monthly RSI, MACD, CCI or ROC. On the daily chart, CoinCodex puts the RSI (14) at 28.87, inside the oversold zone, which reflects the heavy selling since the unlock.
Investing
Only two oscillators have monthly readings. STOCH at 51.56 signals Neutral, sitting near the middle of its range, and Bull/Bear Power at 0.0002 signals Buy, though it is barely above zero.
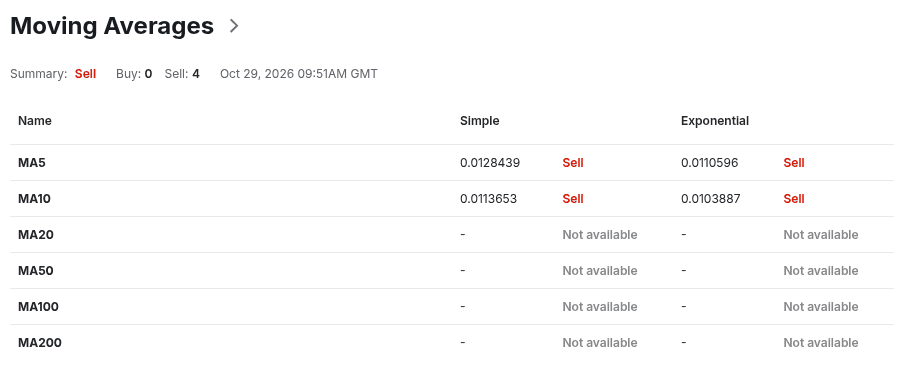
Moving averages are clearly bearish. RAIN trades below its 5-month SMA of $0.0128 and 5-month EMA of $0.0111, as well as the 10-month SMA of $0.0114 and 10-month EMA of $0.0104.
On Investing.com’s monthly classic pivots, RAIN sits below S1 at $0.009236 and about 8% above S2 at $0.006214, the next level below.
These signals describe trend conditions, not price targets.
RAIN Key Price Levels
Investing.com’s monthly classic pivots place the pivot point at $0.0133, about 96% above the current price.
| Level | USD Price |
|---|---|
| Resistance 3 | $0.0234 |
| Resistance 2 | $0.0203 |
| Resistance 1 | $0.0163 |
| Pivot Point | $0.0133 |
| Support 1 | $0.009236 |
| Support 2 | $0.006214 |
| Support 3 | $0.002173 |
RAIN has already slipped below S1, so the $0.009236 level now acts as the first resistance. A monthly close back above it would be an early sign of stabilisation, and the pivot at $0.0133 sits close to both the 30-day high and the 5-month SMA.
On the downside, RAIN is already testing its 30-day low of $0.006741. Below it, S2 at $0.006214 is the next calculated support, while CoinCodex’s targets for next week sit lower still. These are calculated reference levels, not confirmed buying and selling zones.
Popular Rain Moving Averages and Oscillators
The following indicators use monthly candles from Investing.com.
| Indicator | Current Value | Signal |
|---|---|---|
| STOCH (9,6) | 51.56 | Neutral |
| Bull/Bear Power (13) | 0.0002 | Buy |
| MA5 (simple / exponential) | $0.0128 / $0.0111 | Sell / Sell |
| MA10 (simple / exponential) | $0.0114 / $0.0104 | Sell / Sell |
RSI, STOCHRSI, MACD, ADX, Williams %R, CCI, ATR, Highs/Lows, the Ultimate Oscillator, ROC and the MA20 to MA200 averages are excluded because Investing.com does not show monthly values for them.
Investing
A simple moving average gives each closing price equal weight. An exponential moving average puts more weight on recent candles. RAIN trades about 35% to 47% below all four averages, which shows that the monthly trend has turned down since the August peak.
Overall, the monthly picture is bearish, and the short history means the few available signals carry limited weight. A monthly close above the 10-month EMA near $0.0104 would be the first sign of improvement.
Correlation
RAIN’s daily returns had a weak-to-moderate positive correlation with Bitcoin and Ethereum over the last 30 and 90 days, and a weak one over the past year.
| Pair | 30-Day Correlation | 90-Day Correlation | 1-Year Correlation |
|---|---|---|---|
| RAIN–BTC | +0.35 | +0.31 | +0.15 |
| RAIN–ETH | +0.41 | +0.34 | +0.22 |
The figures are based on CoinGecko daily prices over the past 30 days, 90 days and year.
Over longer periods, RAIN has mostly moved on its own supply events, burns and listings rather than on Bitcoin’s direction. Over the 90-day window it lost about 49%, while BTC gained roughly 26% and ETH about 23%.
The slightly higher 30-day reading suggests that RAIN has followed the wider market a little more closely in recent weeks. A low long-term correlation does not protect RAIN from a broader sell-off, and correlation can change quickly.
Is Rain a Good Investment?
Rain operates in one of the fastest-growing corners of crypto. Prediction markets have attracted large volumes around elections and sports, and Rain’s open model lets anyone create a market. The planned V2 upgrade, with an on-chain order book and AI-assisted resolution, could make the platform faster and deeper if it launches as described.
The risks are substantial. RAIN trades about 65% below its August high and lost about 46% in the past month. Daily trading volume is tiny compared with a $4.8 billion market cap, which means larger orders can move the price sharply. Around 38% of the issued supply is still locked, Kraken has delisted the token, and regulators in several countries are paying closer attention to prediction markets.
Supply is not only growing. In August, a governance vote approved a burn of about 7.42 billion RAIN, roughly 1% of circulating supply, shortly before the token set its all-time high. Further burns could offset part of the unlock pressure, but they depend on governance decisions and are not guaranteed.
The monthly technical rating is Neutral, with moving averages signalling Sell, and the forecasts reviewed here range from a further decline to a strong rebound. RAIN may suit investors who want high-risk exposure to prediction markets and can handle sharp swings. Whether it fits a portfolio depends on your risk tolerance and time horizon.
Rain Price Prediction FAQ
What Is RAIN’s Price Prediction Today?
RAIN trades at $0.006764, and short-term models see it near $0.006902 today, about 2% above the current price. The same models point to a slide toward $0.005301 in early November. These are model estimates, not guaranteed boundaries.
What Is the Rain Price Prediction for This Week?
RAIN is forecast to trade between $0.005441 and $0.006902 this week, from about 20% below to 2% above the current price.
What Is the Rain Price Prediction for Next Week?
RAIN is forecast to trade between $0.005085 and $0.005441 next week, about 20% to 25% below the current price.
What Will the Price of Rain be Next Month?
RAIN is expected to trade between $0.005236 and $0.0152 in November 2026, with an average of $0.00926. That is about 37% above the current price.
What Is the RAIN Price Prediction for 2026?
The RAIN price prediction for 2026 is $0.004821 to $0.0621, with an average of $0.0308, about 355% above the current price. The upper end comes from a single bullish model and is far above the recent trend.
What Is the Rain Price Prediction for 2027?
Forecasts for 2027 range from $0.004743 to $0.0291, with an average of $0.018, about 167% above today’s price.
What Is the Rain Coin Price Prediction for 2030?
Forecasts for 2030 range from $0.008096 to $0.1048, with an average of $0.053, about 684% above the current price.
Will Rain Reach $0.1?
RAIN could reach $0.1 in 2029 in the most bullish forecast, and the average forecast passes that level in 2035. The target requires a gain of about 1,378% and implies a market cap of roughly $71 billion at today’s supply.
Will Rain Reach $1?
No forecast reviewed here reaches $1. The target requires a gain of about 14,684% and implies a market cap of roughly $711 billion at today’s supply, or $1.15 trillion with the full supply in circulation.
How High Can Rain Go?
The highest forecast reviewed here is $0.5952, a model estimate for 2050. It is a speculative figure rather than a dependable ceiling, and it would imply a market cap of about $423 billion at today’s supply.
What Is the Future of Rain?
Rain’s future depends on whether its V2 upgrade attracts traders and market creators, and on how the market absorbs the remaining locked supply. Regulation of prediction markets and competition from larger platforms will also shape its path.
Is Rain Crypto Safe?
RAIN carries high risk. Its trading volume is thin compared with its market cap, a large share of supply is still locked, and some exchanges, including Kraken, have delisted it. Smart contract risk and regulatory pressure on prediction markets add further uncertainty.
What Affects the Price of Rain?
RAIN responds to Bitcoin’s direction, overall market liquidity and sentiment. Token unlocks and burns, prediction market volumes around major events, the V2 launch, exchange listings and delistings, and regulation also matter.
How to Buy Rain Crypto: Quick-Step Guide
StealthEX is here to help you buy Rain coin if you’re looking for a way to invest in this cryptocurrency. You can buy RAIN privately and without the need to sign up for the service. StealthEX crypto collection has more than 2,000 different coins and you can do wallet-to-wallet transfers instantly and problem-free.
Just go to StealthEX and follow these easy steps:
- Choose the pair and the amount you want to exchange — for instance, ETH to RAIN.
- Press the “Start exchange” button.
- Provide the recipient address to transfer your crypto to.
- Process the transaction.
- Receive your crypto coins.
Follow us on Medium, X, Telegram, YouTube, and Publish0x to stay updated about the latest news on StealthEX.io and the rest of the crypto world.
Don’t forget to do your own research before buying any crypto. The views and opinions expressed in this article are solely those of the author.
Arbitrum crypto price prediction price analysis price prediction RainRecent Articles on Cryptocurrency