Shiba Inu Price Prediction 2026, 2027-2030, 2050: Forecast and Price Targets


Shiba Inu is the dog-themed meme coin that grew into an ecosystem with its own layer-2 network, Shibarium. This Shiba Inu price prediction covers the next month, the end of 2026 and long-term scenarios up to 2050. SHIB currently trades at $0.00000446, with a market cap of about $2.63 billion, based on CoinGecko data. Every figure below is a scenario, not a promise, and meme coins can move far outside any range.
The SHIB token price has had a difficult year, falling about 55% over the past 12 months and 17% over the past 30 days. That weakness shapes most forecasts, which see little upside in the near term. Long-term models are more optimistic, but they also disagree more, so the gap between the Bear and Bull cases grows quickly after 2027.
| Scenario | 2026 | 2030 | 2050 |
|---|---|---|---|
| Bear Case | $0.0000019 | $0.00000217 | $0.0000148 |
| Base Case | $0.000003794 | $0.000009041 | $0.00001671 |
| Bull Case | $0.000017 | $0.0000459 | $0.00002083 |
Article contents
- 1 What Is Shiba Inu and What Gives SHIB Value?
- 2 Short-Term Shiba Inu Price Targets
- 3 What Drives the SHIB Price?
- 4 Forecast Scenarios and Assumptions
- 5 Long-Term Shiba Inu Prediction (2026-2050)
- 6 SHIB Technical Analysis and Key Levels
- 7 Can SHIB Reach 1 Cent, 10 Cents, 50 Cents, $1 or $1,000?
- 8 Shiba Inu Price Prediction: Questions and Answers
- 9 Key Risks and Forecast Invalidation
- 10 How to Buy Shiba Inu: Quick-Step Guide
- 11 Conclusion
What Is Shiba Inu and What Gives SHIB Value?
Shiba Inu launched in August 2020 as an ERC-20 token on Ethereum, created by an anonymous founder known as Ryoshi. The initial supply was one quadrillion SHIB. According to Shibburn, about 410.85 trillion tokens, or 41.08% of the original amount, have been sent to dead addresses, leaving a total supply of about 589.15 trillion.
SHIB is no longer just a token. The ecosystem includes the ShibaSwap exchange, the BONE governance token and Shibarium, an Ethereum layer-2 network whose mainnet went live on August 16, 2023. BONE is the network’s gas token, according to the official docs.
In practice, SHIB’s value still comes mostly from liquidity, brand recognition and a very large holder base. It ranks 38th by market cap and trades on almost every major exchange. SHIB reached its all-time high of $0.00008616 in late October 2021 and now sits about 95% below that level.
Shiba Inu Price History
SHIB traded at tiny fractions of a cent for most of its first year, with an all-time low of $0.00000000005637 in November 2020. The breakout came in 2021, when Ethereum co-founder Vitalik Buterin sent most of the tokens he had received from the team to a dead address. That single burn accounts for the bulk of the 410.85 trillion SHIB removed from supply so far.
The rally peaked in late October 2021, and the 2022 bear market then cut the price by more than 80%. SHIB never returned to its peak in later cycles. Over the past year, it briefly touched $0.00001015 in mid-November 2025 and then fell to a low of $0.000004115 in July 2026.
A short rebound in mid-October 2026 took SHIB to about $0.000005541, but the gains faded within weeks. The token now trades near the bottom of its 30-day range of $0.00000432 to $0.000005541.
Short-Term Shiba Inu Price Targets
Short-term forecasts expect SHIB to stay under pressure. The ranges for the coming months sit mostly below the current price, and only the most bullish model sees a strong recovery by the end of 2026.
| Period | Bear Case | Base Case | Bull Case |
|---|---|---|---|
| Next Month | $0.000003851 | $0.000004164 | $0.000004311 |
| In Six Months (May 2027) | $0.000003502 | $0.000003589 | $0.00000367 |
| End of Year 2026 | $0.0000019 | $0.000003794 | $0.000017 |
For the next month, the range is $0.000003851 (-14%) to $0.000004311 (-3%), with a Base case of $0.000004164 (-7%). For the end of 2026, the Base case is $0.000003794 (-15%), while the Bull case of $0.000017 (+281%) comes from a single, very wide model. The six-month view stays near $0.0000036, which points to a slow grind rather than a recovery.
Other short-term models agree on the direction. CoinLore sees about $0.0000042 next week, and CoinCodex expects roughly $0.000004331 a month from now. The first level to watch is S1 at $0.0000041, as a monthly close below it would bring the lower targets into play.
What Drives the SHIB Price?
The broad crypto market matters most. SHIB’s 30-day correlation with Bitcoin is 0.801 and with Ethereum 0.782, based on CoinGecko daily prices. Yet over the past 90 days, SHIB fell about 1.5% while Bitcoin rose about 19% and Ethereum about 13%, so it has lagged even during market strength.
| Pair | 30-Day Correlation | 90-Day Correlation | 1-Year Correlation |
|---|---|---|---|
| SHIB–BTC | +0.801 | +0.809 | +0.687 |
| SHIB–ETH | +0.782 | +0.751 | +0.686 |
Shibarium activity is the second factor. Shibariumscan shows daily transactions mostly in the low hundreds to low thousands: 650 on October 17, a one-day spike to 7,296 on October 19, and 843 on November 9. DefiLlama puts Shibarium’s total value locked at about $44,414. Gas on the network is paid in BONE, not SHIB, according to the official docs, so that thin activity does not by itself create direct buying pressure for SHIB.
The burn rate is the third factor, and it is weaker than many holders expect. Shibburn shows about $1,627 of SHIB burned over the past 30 days, against a remaining supply of about 589.15 trillion. At that pace burns support sentiment more than the circulating float.
Trading activity is another warning sign. SHIB’s 24-hour volume is about $45.2 million, only around 1.7% of its market cap and far below the volume of some smaller meme coins.
Development and leadership round out the picture. Recent upgrades added x402 payments, which let AI agents pay in SHIB, TREAT or wrapped BONE, plus new developer tools on Shibarium. At the same time, lead developer Shytoshi Kusama has not posted publicly since May 2026, which leaves the community without a clear roadmap. Clear leadership and a visible plan have often mattered for meme coin sentiment, so this silence weighs on confidence.
Forecast Scenarios and Assumptions
The scenarios use forecasts from CoinCodex, Changelly, CoinLore and CoinDataFlow. The Bear case is the lowest figure among them, the Bull case is the highest, and the Base case reflects their typical average.
All changes are measured from the current price of $0.00000446. Implied market caps use the circulating supply of about 589.24 trillion SHIB from CoinGecko. These are third-party model outputs, not a StealthEX forecast. CoinCodex and Changelly produce very similar figures, while CoinLore and CoinDataFlow are much more optimistic for the years after 2027.
Coverage narrows over time. The 2040 figures rely on three sources and 2050 on two, which is why the 2050 Base case is lower than the 2040 one. The scenarios would lose relevance if SHIB broke well below its recent lows or if burns accelerated sharply.
Long-Term Shiba Inu Prediction (2026-2050)
| Year | Bear Case | Base Case | Bull Case | Base Case Market Cap |
|---|---|---|---|---|
| 2026 | $0.0000019 | $0.000003794 | $0.000017 | $2.24 billion |
| 2027 | $0.00000231 | $0.000004306 | $0.0000149 | $2.54 billion |
| 2028 | $0.00000262 | $0.000005417 | $0.0000355 | $3.19 billion |
| 2029 | $0.00000208 | $0.00001015 | $0.0000626 | $5.98 billion |
| 2030 | $0.00000217 | $0.000009041 | $0.0000459 | $5.33 billion |
| 2040 | $0.00000631 | $0.00002821 | $0.000208 | $16.62 billion |
| 2050 | $0.0000148 | $0.00001671 | $0.00002083 | $9.85 billion |
The long-term picture splits into two camps. CoinCodex and Changelly expect SHIB to keep falling until about 2030, while CoinLore and CoinDataFlow see a recovery from 2028. None of the scenarios through 2030 returns SHIB to its all-time high, and only CoinLore’s 2040 bull case goes beyond it.
Shiba Inu Price Prediction 2026
SHIB is expected to trade between $0.0000019 (-57%) and $0.000017 (+281%) in 2026, with a Base case of $0.000003794 (-15%).
- CoinCodex: $0.000003851 to $0.000004534.
- Changelly: $0.00000426 to $0.00000438.
- CoinLore: $0.0000019 to $0.000017.
- CoinDataFlow: $0.0000031 to $0.0000045.
CoinCodex and Changelly expect SHIB to hold close to today’s level. CoinLore’s average of $0.0000028 is far below the current price, which pulls the Base case down. A monthly close back above the pivot at $0.00000506 would challenge the cautious view.
Shiba Inu Price Prediction 2027
The 2027 range is $0.00000231 (-48%) to $0.0000149 (+234%), with a Base case of $0.000004306 (-3%).
- CoinCodex: $0.000002969 to $0.000004421.
- Changelly: $0.00000231 to $0.00000537.
- CoinLore: $0.0000024 to $0.0000149.
- CoinDataFlow: $0.000003 to $0.0000082.
Most sources place their averages near or below the current price. CoinDataFlow is the most constructive, with an average of $0.0000056. The year looks like a waiting period unless Shibarium usage or the broader meme market picks up.
Shiba Inu Price Prediction 2028
The 2028 range is $0.00000262 (-41%) to $0.0000355 (+696%), with a Base case of $0.000005417 (+21%).
- CoinCodex: $0.000002687 to $0.000003278.
- Changelly: $0.00000262 to $0.00000319.
- CoinLore: $0.0000037 to $0.0000355.
- CoinDataFlow: $0.0000053 to $0.000014.
This is where the sources split. CoinCodex and Changelly see SHIB about 30% below today’s price, while CoinDataFlow’s average of $0.00000965 would roughly double it. The Base case of about $3.19 billion in market cap sits between those views.
Shiba Inu Price Prediction 2029
The 2029 range is $0.00000208 (-53%) to $0.0000626 (+1,304%), with a Base case of $0.00001015 (+128%).
- CoinCodex: $0.000002122 to $0.000002828.
- Changelly: $0.00000208 to $0.00000276.
- CoinLore: $0.0000039 to $0.0000626.
- CoinDataFlow: $0.000012 to $0.000047.
CoinDataFlow’s average of $0.0000295 lifts the Base case far above the other three sources. Without it, the 2029 picture would sit near or below today’s price. Treat this year’s Base case as sensitive to one bullish model.
Shiba Inu Price Prediction 2030
The 2030 range is $0.00000217 (-51%) to $0.0000459 (+929%), with a Base case of $0.000009041 (+103%). At that Base case, SHIB’s market cap would be about $5.33 billion, roughly double today’s level.
- CoinCodex: $0.000002232 to $0.000003016.
- Changelly: $0.00000217 to $0.00000294.
- CoinLore: $0.0000062 to $0.0000459.
- CoinDataFlow: $0.0000092 to $0.000034.
The Bull case of $0.0000459 would imply a market cap of about $27.1 billion, about ten times today’s level but still below SHIB’s 2021 peak valuation. That outcome needs both a strong meme market and real Shibarium growth.
Shiba Inu Price Prediction 2040
This is a high-uncertainty horizon. The range is $0.00000631 (+41%) to $0.000208 (+4,564%), with a Base case of $0.00002821 (+533%).
- CoinCodex: $0.00000666 to $0.000007377.
- Changelly: $0.00000631 to $0.00000699.
- CoinLore: $0.0000426 to $0.000208.
The Base case implies a market cap of about $16.62 billion. CoinLore’s bull case would mean more than $122 billion and a price more than double the 2021 high, while the other two sources stay below $0.000008.
Shiba Inu Price Prediction 2050
Only CoinCodex and Changelly cover 2050. The range is $0.0000148 (+232%) to $0.00002083 (+367%), with a Base case of $0.00001671 (+275%).
- CoinCodex: $0.00001606 to $0.00002083.
- Changelly: $0.0000148 to $0.0000189.
The Base case implies a market cap of about $9.85 billion. This is an illustrative scenario that assumes SHIB survives for decades with roughly today’s supply.
SHIB Technical Analysis and Key Levels
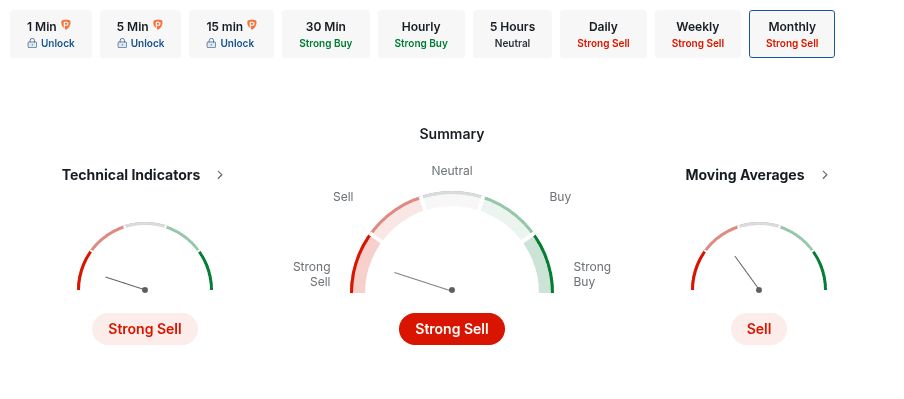
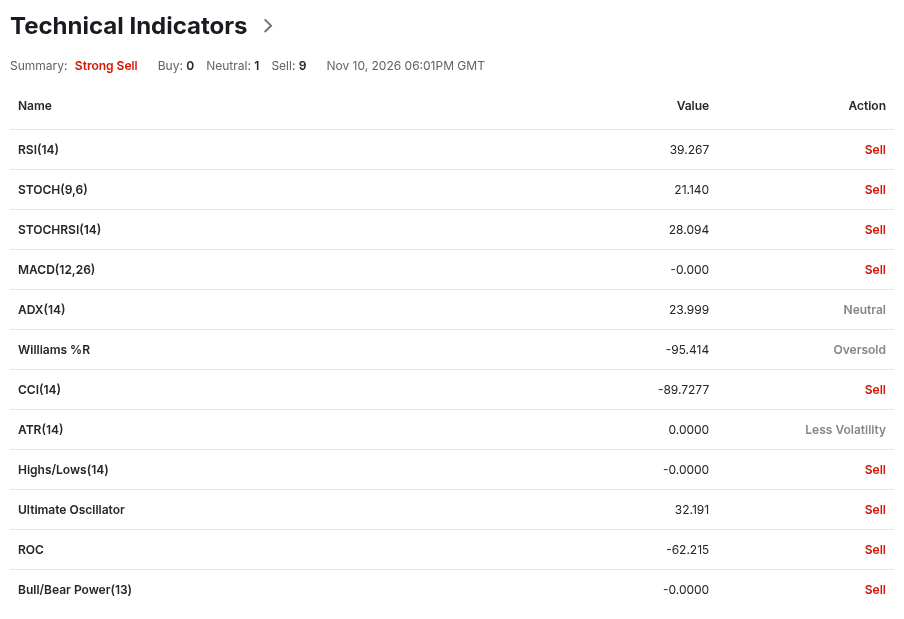
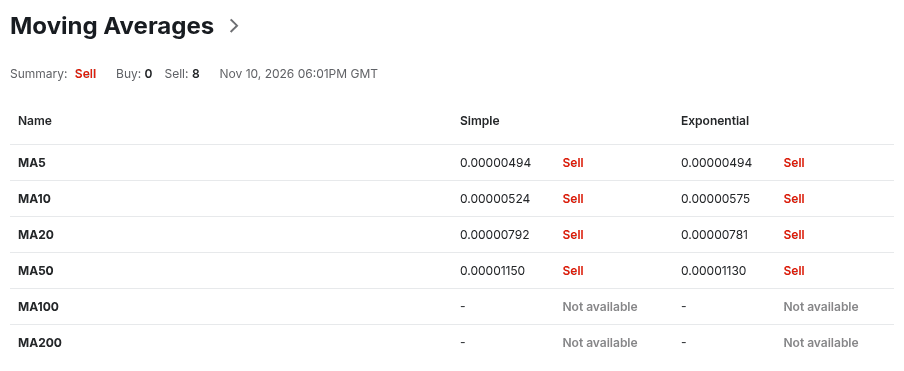
This Shiba Inu price analysis uses the monthly chart. Investing.com gives SHIB an overall Strong Sell rating on the monthly timeframe. Technical indicators signal Strong Sell (0 buy, 1 neutral, 9 sell), and moving averages signal Strong Sell (0 buy, 8 sell).
Investing
The monthly RSI (14) sits at 39.267, below the neutral zone, and MACD is just below zero. Williams %R at -95.414 shows oversold conditions, which sometimes comes before a relief bounce. STOCH at 21.14, CCI at -89.7277 and ROC at -62.215 all signal Sell, while ADX at 23.999 shows only a moderate trend.
Investing
| Indicator | Current Value | Signal |
|---|---|---|
| RSI (14) | 39.267 | Sell |
| STOCH (9,6) | 21.14 | Sell |
| MACD (12,26) | Slightly below 0 | Sell |
| ADX (14) | 23.999 | Neutral |
| Williams %R | -95.414 | Oversold |
| MA5 (simple / exponential) | $0.00000494 / $0.00000494 | Sell / Sell |
| MA10 (simple / exponential) | $0.00000524 / $0.00000575 | Sell / Sell |
| MA20 (simple / exponential) | $0.00000792 / $0.00000781 | Sell / Sell |
| MA50 (simple / exponential) | $0.0000115 / $0.0000113 | Sell / Sell |
Investing
SHIB trades below every monthly moving average, from the 5-month SMA at $0.00000494 to the 50-month SMA at $0.0000115. That structure describes a long-term downtrend, and the gap to the 20-month averages near $0.0000079 shows how far the price has fallen since its last strong rally. The daily chart from CoinCodex agrees, with a Bearish sentiment and a daily RSI of 35.63.
| Classic Pivot Level | Price |
|---|---|
| R3 | $0.00000718 |
| R2 | $0.0000066 |
| R1 | $0.00000564 |
| Pivot Point | $0.00000506 |
| S1 | $0.0000041 |
| S2 | $0.00000352 |
| S3 | $0.00000256 |
SHIB sits between S1 at $0.0000041 and the pivot at $0.00000506. A drop below S1 would expose S2 at $0.00000352, close to the lower end of the 2027 forecasts. A sustained move above $0.00000506 would open the way to R1 at $0.00000564 and the 10-month EMA. These signals describe trend conditions, not price targets.
Can SHIB Reach 1 Cent, 10 Cents, 50 Cents, $1 or $1,000?
| Target | Gain Needed | Implied Market Cap |
|---|---|---|
| $0.0001 | +2,142% | $58.92 billion |
| $0.001 | +22,322% | $589.24 billion |
| $0.01 (1 cent) | +224,115% | $5.89 trillion |
| $0.1 (10 cents) | +2,242,052% | $58.92 trillion |
| $0.5 (50 cents) | +11,210,662% | $294.62 trillion |
| $1 | +22,421,425% | $589.24 trillion |
| $1,000 | +22,421,524,564% | $589.24 quadrillion |
Even $0.0001 would require a market cap of about $59 billion, higher than SHIB has ever reached. The most bullish scenario in this article, $0.000208 in 2040, is still almost 5 times below $0.001.
Can SHIB reach 1 cent? At the current supply, 1 cent implies a market cap of about $5.89 trillion, larger than the entire crypto market has ever been. Burns would have to remove almost all remaining tokens to make it realistic, and the current pace removes less than 1 billion SHIB a month.
10 cents, 50 cents, $1 and $1,000 would need market caps from $58.9 trillion to $589 quadrillion. Even the lowest of those figures is more than ten times the size of the entire crypto market, so they are not achievable under any scenario. They mostly show how much the size of the supply limits the price per token.
Shiba Inu Price Prediction: Questions and Answers
Can Shiba Go Up?
Yes, but the near-term signals are weak. The monthly rating is Strong Sell, and the next-month Base case is $0.000004164, about 7% below the current price.
Does SHIB Have a Future?
SHIB has a large community, wide exchange access and its own layer-2 network. Its future depends on whether Shibarium usage grows and the meme coin market recovers.
Should I Buy SHIB?
SHIB suits only investors who accept extreme volatility and the risk of large losses. The price is down about 55% over the past year.
What Is the Shiba Inu Price Prediction for 2030?
The 2030 range is $0.00000217 to $0.0000459, with a Base case of $0.000009041.
Can Shiba Inu Reach 1 Cent?
It is extremely unlikely. 1 cent implies a market cap of about $5.89 trillion at the current supply.
How Much SHIB Has Been Burned?
About 410.85 trillion SHIB, or 41.08% of the original one quadrillion supply.
Key Risks and Forecast Invalidation
- Weak usage: Shibarium activity and TVL remain very low.
- Leadership: the lead developer has been silent for months.
- Supply: burns are too small to offset selling pressure.
- Market dependence: SHIB follows Bitcoin and Ethereum closely but has lagged their gains.
- Competition: newer meme coins draw attention and liquidity away from older ones.
A monthly close below S2 at $0.00000352 would invalidate the Base case for 2026. A move back above R2 at $0.0000066 would weaken the Bear case. Meme coins can lose most of their value quickly.
How to Buy Shiba Inu: Quick-Step Guide
StealthEX allows you to swap Shiba Inu (SHIB) quickly and privately. You do not need to create an account. The platform supports more than 2,000 cryptocurrencies with direct wallet-to-wallet exchanges.
This means you keep full control over your funds during the entire process.
Just follow these simple steps:
- Choose the crypto pair and enter the amount (for example, BTC to SHIB).
- Click the “Start Exchange” button.
- Enter your Shiba Inu wallet address where you want to receive the tokens.
- Send the required crypto to the deposit address provided by StealthEX.
- Receive SHIB directly in your wallet after the swap completes.
That’s it. The entire process usually takes only a few minutes. You do not need to register, verify an account, or deposit funds on an exchange.

Conclusion
The SHIB outlook is cautious in the short term and mixed in the long term. The Base case points to $0.000003794 at the end of 2026, $0.000009041 in 2030 and $0.00001671 in 2050. The monthly rating is Strong Sell, SHIB trades below all its monthly moving averages, and Shibarium usage is low.
A recovery would need a stronger meme coin market and real growth on Shibarium. The first technical sign would be a monthly close above the pivot at $0.00000506.
Don’t forget to do your own research before buying any crypto. The views and opinions expressed in this article are solely those of the author.
crypto price prediction price analysis SHIB Shiba Inu ShibaSwapRecent Articles on Cryptocurrency