XDC Price Prediction 2026-2040: Will XDC Network Reach $10?


XDC Network is an enterprise-focused blockchain for trade finance, payments and tokenized real-world assets. This XDC price prediction covers 2026 to 2050 and shows how market conditions and network developments could shape the price. XDC currently trades at $0.031, based on CoinGecko data. Long-term figures are uncertain scenarios, not promises.
Article contents
- 1 Quick Answer: XDC Price and Forecast Range
- 2 How the Scenarios Are Built
- 3 XDC Network Overview
- 4 XDC Crypto Features
- 5 Recent XDC Network Developments
- 6 Current XDC Market Snapshot
- 7 XDC Price History
- 8 What Could Drive or Weaken the XDC Price?
- 9 XDC Price Prediction: Bear, Base, and Bull Scenarios
- 10 XDC Price Prediction 2026
- 11 XDC Price Prediction 2027–2029
- 12 XDC Price Prediction 2030
- 13 XDC Price Prediction 2035
- 14 XDC Price Prediction 2040
- 15 XDC Price Prediction 2050
- 16 Can XDC Reach $1, $10, $100, or $1,000?
- 17 XDC Price Prediction: What Do Experts Say?
- 18 XDC Technical Analysis
- 19 Risks and Scenario Invalidation
- 20 Conclusion
- 21 FAQ: XDC Price Prediction
Quick Answer: XDC Price and Forecast Range
| Scenario | 2026 | 2030 | 2040 |
|---|---|---|---|
| Bear Case | $0.0123 | $0.0331 | $0.0699 |
| Base Case | $0.028 | $0.0876 | $0.245 |
| Bull Case | $0.0971 | $0.2732 | $1.2 |
Can XDC reach $1? Only the most bullish 2040 scenario goes above $1. At the current circulating supply, $1 would mean a market cap of about $19.95 billion, or a 32.3x gain.
Can XDC reach $10? None of the forecasts supports it. $10 implies a market cap of about $199.5 billion at the current supply.
How the Scenarios Are Built
The Bear, Base and Bull cases use forecasts from CoinCodex, CoinLore and CoinDataFlow:
- Bear case: the most bearish figure among them.
- Bull case: the most bullish figure.
- Base case: the mean of their average prices.
All changes are calculated from the same current price of $0.031, and implied market caps use the circulating supply of 19.95 billion XDC from CoinGecko.
These are third-party model outputs, not a StealthEX forecast. Coverage narrows over time: 2040 relies on CoinCodex and CoinLore only, and 2050 on CoinCodex only. The Base case would weaken if XDC drops below its recent lows or if network activity and partnerships fail to grow.
XDC Network Overview
XDC Network started in 2017 as XinFin, a project that aimed to connect public blockchain technology with trade and finance. It is an EVM-compatible layer-1 network, so developers can deploy Ethereum-style smart contracts. It runs on the upgraded XDPoS consensus, a delegated proof-of-stake consensus model, and supports Subnets for private, permissioned deployments, according to XDC Network.
What is XDC used for? The token pays network fees, is staked by masternode operators and is used in apps for tokenization, payments and trade finance. CoinGecko also lists XDC among real-world asset (RWA) projects.
How XDC Consensus and Masternodes Work
XDC token holders vote for masternode candidates, and the top 108 become active validators that take turns producing blocks. According to the XDC documentation, each masternode must stake 10 million XDC and complete a KYC process. Standby nodes post the same stake and replace validators that drop out. At today’s price, that stake is worth about $310,000, and the 108 active seats alone lock at least 1.08 billion XDC, or about 5% of the circulating supply.
The network’s second-generation consensus upgrade went live on September 30, 2024. It added a Byzantine fault-tolerant committee and forensic monitoring that can prove which validators misbehaved. Blocks arrive about every two seconds, and transactions are final after three blocks, or roughly six seconds.
XDC Crypto Features
- EVM compatibility: existing Ethereum tools and contracts can run on XDC.
- Speed and cost: the documentation lists about 2-second blocks, more than 2,000 transactions per second and fees below $0.0001; a simple transfer costs about $0.00004.
- XDPoS consensus: 108 KYC-verified validators secure the network with fast finality.
- Subnets: businesses can run private chains connected to the public network.
- Tokenization tools: XDC targets trade documents, stablecoins and real-world assets.
The trade-off is a smaller validator set than on the largest proof-of-stake networks, which raises questions about decentralization. The KYC requirement helps institutions join, but it also means validators are known and fewer in number.
Recent XDC Network Developments
October was one of XDC’s busiest months, according to Genfinity:
| Date | Development |
|---|---|
| October 7 | Swiss bank-infrastructure firm Taurus joined as an institutional validator |
| October 8 | Robinhood (US) and CoinTrade (Japan) listed XDC |
| October 14 | The AI payments marketplace was renamed XDC SI |
| October 15 | MoneyGram announced plans to run a validator node |
| October 16 | Concordium became the identity layer for agents, and a public x402 payment facilitator opened |
| October 20 | SBI XDC, SBI VC Trade and Shinhan Card signed a yen stablecoin MOU |
| October 24 | Orochi Network announced a zkDatabase integration for RWA data |
Main Use Cases
- Trade finance: SBI XDC Network APAC, a joint venture between SBI and TradeFinex Tech, has worked on domestic trade finance, including vLEI-based factoring with TOPPAN.
- Tokenized assets: XDC LATAM is active in Brazil, where nearly BRL 8 billion (about $1.4 billion) in tokenized assets have been issued across the market.
- Trading: Quote.Trade, an XDC-native dark pool DEX, offers more than 1,500 markets with USDC settlement.
- Verifiable data: Orochi claims its zkDatabase cuts data costs from about $25 per KB on Ethereum to $0.002 on XDC.
These are meaningful names, but most deals are early. MoneyGram serves roughly 60 million active customers in more than 200 countries and territories, yet its validator seat gives it a role in consensus, not a move of its remittance flows, and its MGUSD stablecoin runs on Stellar. The yen stablecoin is a proof-of-concept with no launch date. The x402 facilitator offers 1,000 free settlements per month and then charges 0.001 USDC each, so token demand from these payments is still small.
Current XDC Market Snapshot
| Metric | Value |
|---|---|
| Current Price | $0.031 |
| Market Cap | $618.2 million |
| Fully Diluted Valuation | $1.18 billion |
| Market Cap Rank | 91 |
| 24-Hour Trading Volume | $26.2 million |
| Circulating Supply | 19.95 billion XDC |
| Total Supply | 38.07 billion XDC |
| Circulating / Total Supply | 52% |
| 30-Day Range | $0.0306 to $0.0357 |
| All-Time High | $0.1928 (August 20, 2021) |
Market data: CoinGecko
XDC has gained 0.8% over 24 hours but lost 7.6% over seven days and 4.6% over 30 days. Over the past year, it is down about 43%.
The supply data matter for any long-term target. About 18.1 billion XDC sit outside circulation, worth roughly $561 million at today’s price, almost as much as the current market cap. CoinGecko lists no maximum supply, so forecasts based on circulating supply may understate the market cap a future price would require.
XDC Price History
XDC first traded on exchanges in April 2018 at about $0.003. According to CoinGecko, it hit its all-time low of $0.000395 on July 21, 2019. The strongest rally came in 2021, when XDC reached its all-time high of $0.1928 on August 20, 2021.
The 2022 bear market pushed the price back to about $0.02. XDC recovered in 2023 and 2024, and early 2025 brought a move above $0.15. Then the trend reversed: XDC traded near $0.06 in November 2025 and finished the year around $0.05. It now sits about 84% below its all-time high.
What Could Drive or Weaken the XDC Price?
Measurable Indicators
- Validators: MoneyGram, Taurus and Amber Premium recently joined a validator set that already includes SBI Holdings, Deutsche Telekom and Hex Trust.
- Exchange access: XDC is now listed on Robinhood, which widens access for US users.
- Supply: only 52% of the total supply circulates, so future releases could add selling pressure.
- Correlation: XDC’s link to the wider market is weak, so network news often matters more than market moves.
| Pair | 30-Day Correlation | 90-Day Correlation | 1-Year Correlation |
|---|---|---|---|
| XDC–BTC | +0.46 | +0.46 | +0.4 |
| XDC–ETH | +0.42 | +0.4 | +0.34 |
Based on CoinGecko daily prices.
Narrative Catalysts
- AI and payments: XDC launched a public x402 facilitator for AI-agent payments and renamed its AI marketplace XDC SI.
- Stablecoins: SBI XDC and Shinhan Card signed a memorandum on a yen stablecoin.
- Identity and privacy: the network added a Concordium identity layer and a zkDatabase partnership with Orochi.
Downside Signals
Weak real usage, slow developer growth, competition from other RWA chains and the gap between partnerships and actual token demand could all weigh on the price.
XDC Price Prediction: Bear, Base, and Bull Scenarios
| Year | Bear Case | Base Case | Bull Case | Base Case Market Cap |
|---|---|---|---|---|
| 2026 | $0.0123 | $0.028 | $0.0971 | $0.56 billion |
| 2027 | $0.0149 | $0.0394 | $0.1323 | $0.79 billion |
| 2028 | $0.0205 | $0.0537 | $0.2436 | $1.07 billion |
| 2029 | $0.0216 | $0.1094 | $0.3908 | $2.18 billion |
| 2030 | $0.0331 | $0.0876 | $0.2732 | $1.75 billion |
| 2035 | $0.06 | $0.2133 | $0.5846 | $4.25 billion |
| 2040 | $0.0699 | $0.245 | $1.2 | $4.89 billion |
| 2050 | $0.1028 | $0.1121 | $0.1291 | $2.24 billion |
Market cap uses the current circulating supply. With the full 38.07 billion supply, each value would be roughly 1.9x higher.
XDC Price Prediction 2026
XDC is expected to trade between $0.0123 (-60%) and $0.0971 (+213%) in 2026, with a Base case of $0.028 (-10%).
- CoinCodex: the most positive, with $0.0313 to $0.041.
- CoinDataFlow: $0.0197 to $0.0329.
- CoinLore: the widest range, $0.0123 to $0.0971, with an average of only $0.0205.
For April 2027, CoinCodex sees $0.0555 to $0.0614, about 90% above the current price. The Base case would improve if XDC holds above $0.0306 and new partnerships bring real volume.
XDC Price Prediction 2027–2029
The Base case rises to $0.0394 (+27%) in 2027, $0.0537 (+73%) in 2028 and $0.1094 (+253%) in 2029. The sources disagree on the pace:
- CoinCodex expects $0.0387 to $0.0805 in 2027 and similar ranges for 2028 and 2029, with averages between $0.0538 and $0.0608.
- CoinLore keeps its averages low, from $0.0249 in 2027 to $0.036 in 2029, but its bull case reaches $0.3378 in 2029.
- CoinDataFlow is the most bullish, with a 2029 average of $0.2384 and a high of $0.3908.
The 2029 peak in the Base case comes mostly from CoinDataFlow. Without it, the outlook for those years would stay close to $0.04 to $0.06, still above the current price but far below the 2021 high.
XDC Price Prediction 2030
The 2030 range is $0.0331 (+7%) to $0.2732 (+781%), with a Base case of $0.0876 (+183%). That would put XDC’s market cap at about $1.75 billion. Reaching it requires steady growth in trade-finance use, tokenization and liquidity.
- CoinCodex: the most cautious source, with a maximum of $0.0515.
- CoinLore: an average of $0.0515.
- CoinDataFlow: $0.0597 to $0.2732, with an average of $0.1664.
CoinCodex and CoinDataFlow both expect a dip from 2029 to 2030, while CoinLore keeps rising.
XDC Price Prediction 2035
The 2035 range is $0.06 (+93%) to $0.5846 (+1,786%), with a Base case of $0.2133 (+588%) and a market cap of about $4.25 billion.
- CoinCodex: $0.06 to $0.092.
- CoinLore: $0.1041 to $0.5846.
- CoinDataFlow: $0.2341 to $0.5509.
Both the Base and Bull cases sit above the all-time high of $0.1928, and both need tokenization on XDC to grow into a large, fee-paying market.
XDC Price Prediction 2040
This is a low-confidence horizon, as uncertainty compounds over many years. CoinCodex expects $0.0699 to $0.11, while CoinLore sees $0.2391 to $1.2. CoinLore’s average of $0.3986 would be about double the all-time high. The Base case of $0.245 implies a market cap of about $4.89 billion at today’s supply.
XDC Price Prediction 2050
Only CoinCodex covers 2050, with a range of $0.1028 to $0.1291 and an average of $0.1121. This is an illustrative scenario, not a forecast, and it would imply a market cap of about $2.24 billion.
Can XDC Reach $1, $10, $100, or $1,000?
| Target | Price Multiple Needed | Market Cap (Circulating Supply) | Market Cap (Total Supply) |
|---|---|---|---|
| $0.1 | 3.2 times | $1.99 billion | $3.81 billion |
| $1 | 32.3 times | $19.95 billion | $38.07 billion |
| $10 | 322.6 times | $199.5 billion | $380.7 billion |
| $100 | 3,225.8 times | $1.99 trillion | $3.81 trillion |
| $1,000 | 32,258.1 times | $19.95 trillion | $38.07 trillion |
A return to $0.1 is plausible in a strong market, as the 2027 Bull case already goes above it. $1 would require XDC to become a top-tier asset, which only the 2040 Bull case allows. $10 and higher would need a market cap far beyond what any forecast supports, so these targets have a very low probability.
XDC Price Prediction: What Do Experts Say?
| Source | Horizon | Range | Method |
|---|---|---|---|
| CoinCodex | 2026–2050 | $0.0313 to $0.1291 | Historical price data and technical indicators |
| CoinLore | 2026–2040 | $0.0123 to $1.2 | Algorithmic model with bear and bull cases |
| CoinDataFlow | 2026–2035 | $0.0189 to $0.5509 | Algorithmic technical analysis |
CoinDataFlow is the most cautious for 2026, with a one-month target of $0.0213 (-31%), and has the highest average forecasts for 2029 to 2035. CoinLore has the widest ranges.
XDC Technical Analysis
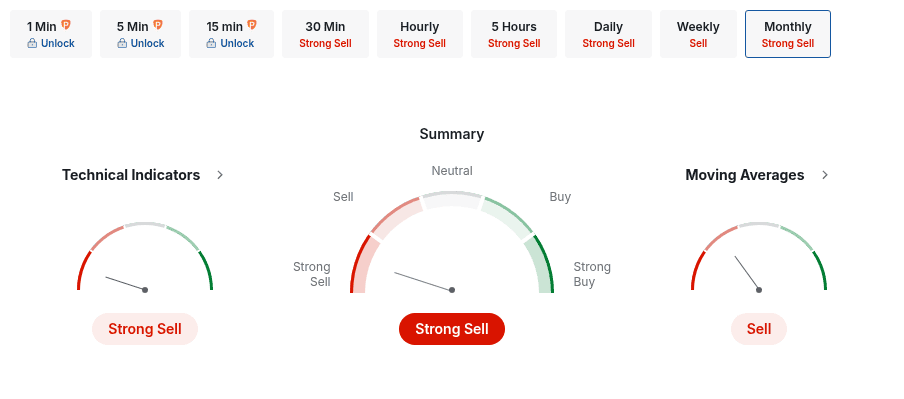
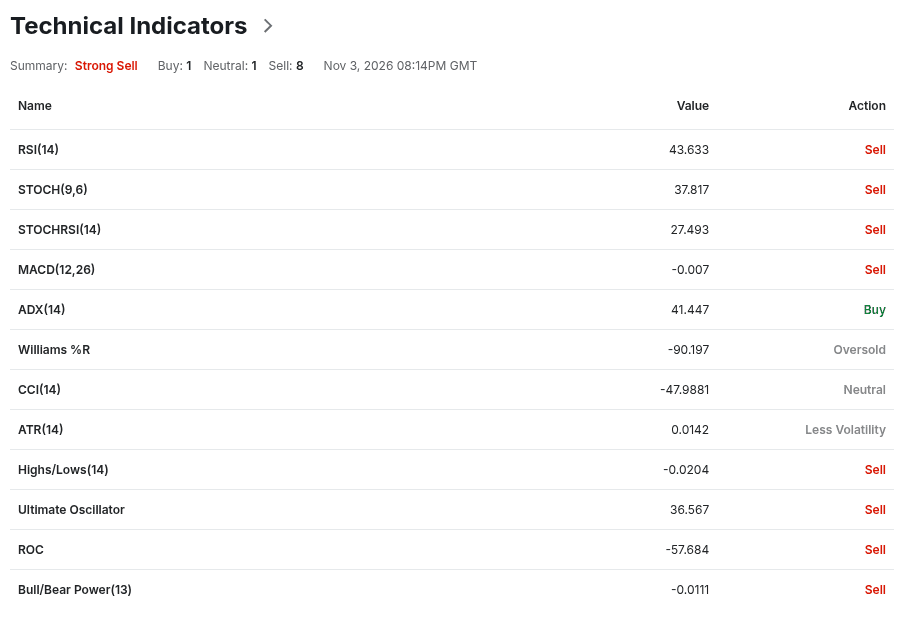
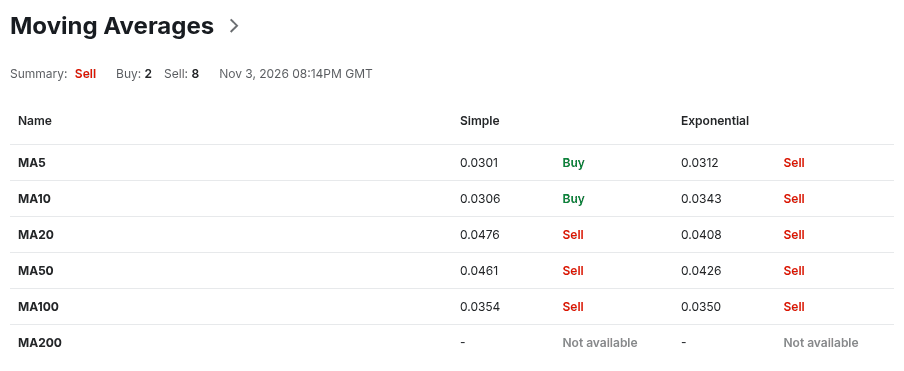
Investing.com gives XDC an overall Strong Sell rating on the monthly timeframe. Technical indicators signal Strong Sell (1 buy, 1 neutral, 8 sell), and moving averages signal Sell (2 buy, 8 sell).
Investing
The monthly RSI (14) sits at 43.633, while MACD at -0.007 confirms bearish momentum. ADX at 41.447 shows a strong trend, which is currently down. Williams %R is oversold, while STOCHRSI at 27.493 signals Sell.
Investing
| Indicator | Current Value | Signal |
|---|---|---|
| RSI (14) | 43.633 | Sell |
| MACD (12,26) | -0.007 | Sell |
| ADX (14) | 41.447 | Buy |
| Williams %R | -90.197 | Oversold |
| MA5 (simple / exponential) | $0.0301 / $0.0312 | Buy / Sell |
| MA10 (simple / exponential) | $0.0306 / $0.0343 | Buy / Sell |
| MA20 (simple / exponential) | $0.0476 / $0.0408 | Sell / Sell |
| MA50 (simple / exponential) | $0.0461 / $0.0426 | Sell / Sell |
| MA100 (simple / exponential) | $0.0354 / $0.035 | Sell / Sell |
Investing
XDC holds just above the 5- and 10-month simple MAs but stays below all exponential and longer averages. Other oscillators lean the same way: STOCH (9,6) at 37.817, the Ultimate Oscillator at 36.567 and ROC at -57.684 all signal Sell, while CCI at -47.9881 is neutral. The monthly ATR of 0.0142 is almost half the current price, so large monthly swings remain likely.
| Classic Pivot Level | Price |
|---|---|
| R3 | $0.0398 |
| R2 | $0.0379 |
| R1 | $0.0346 |
| Pivot Point | $0.0327 |
| S1 | $0.0295 |
| S2 | $0.0276 |
| S3 | $0.0243 |
Monthly classic pivots: Investing
The price sits between S1 and the pivot point. A monthly close above $0.0327 would open the way to R1 at $0.0346, while a drop below $0.0295 would expose S2 at $0.0276. These signals inform the short-term outlook only and cannot support 2030 to 2050 forecasts.
Risks and Scenario Invalidation
- Market and liquidity: low volume can amplify price swings.
- Supply: about 18 billion XDC are outside circulation.
- Adoption: partnerships may not turn into token demand.
- Competition and regulation: other RWA networks and new rules could slow growth.
- Security and governance: a smaller validator set brings concentration risk.
- Listing quality: Robinhood disclosed that it received integration fees related to XDC support, so a listing does not by itself prove organic demand.
The Bull case would be invalidated by a drop below $0.0276 (S2), while the Bear case would weaken if XDC climbs back above its 20-month MA. Investors can lose all invested capital.
Conclusion
The Base case points to $0.0876 in 2030 and $0.245 in 2040. $1 would require major adoption, and $10 is not supported by any current forecast.
XDC’s strengths are real: fast and cheap transactions, regulated validators and new retail access in the US and Japan. The weak side is the price trend and the gap between announced partnerships and actual on-chain activity. In the near term, a monthly close above the $0.0327 pivot would be the first sign of recovery.

FAQ: XDC Price Prediction
Is XDC a Good Investment?
XDC has real enterprise use, new validators and wider exchange access, but the monthly rating is Strong Sell and only half the supply circulates. It suits only investors who accept high volatility.
How High Can XDC Go?
The Bull case reaches $0.2732 by 2030 and $1.2 by 2040, which would mean a market cap of about $23.9 billion.
What Does XDC Do?
XDC pays network fees, secures the chain through staking and supports tokenization and trade-finance apps.
What Is the XDC All-Time High?
XDC reached $0.1928 on August 20, 2021. It would need about a 6x gain to return there.
Can XDC Reach $1?
Only the most bullish 2040 scenario goes above $1, which requires a market cap of about $19.95 billion.
Will XDC Hit $100 or $1,000?
No forecast supports it. $100 implies a market cap of about $1.99 trillion, and $1,000 about $19.95 trillion.
What Is the XDC Price Prediction for 2040 and 2050?
The Base case is $0.245 for 2040 and $0.1121 for 2050, with very low confidence.
Is XDC Listed on Robinhood?
Yes. Robinhood added XDC for eligible US customers, although New York residents cannot trade it. Japan’s CoinTrade listed XDC on the same day.
Don’t forget to do your own research before buying any crypto. The views and opinions expressed in this article are solely those of the author.
crypto price prediction investment price prediction XDC XinFinRecent Articles on Cryptocurrency