Bitcoin Cash (BCH) Price Prediction 2026, 2027-2030



Bitcoin Cash is a peer-to-peer payment network that split from Bitcoin in 2017 to allow bigger blocks and cheaper transactions, and BCH is its native coin. This Bitcoin Cash price prediction looks at whether new institutional products can help BCH recover after a difficult year. BCH currently trades at $282, compared with a 30-day range of $258.58 to $345.64.
BCH has gained 1.2% in 24 hours and 0.9% over seven days, but it is down 16% over 30 days and about 50% lower than a year ago. According to CoinGecko, Bitcoin Cash’s market capitalization stands near $5.7 billion, ranking it 21st among cryptocurrencies, while 24-hour trading volume is about $149 million. More than 20.1 million BCH are already in circulation out of a maximum supply of 21 million.
Institutional access has improved this month. CME Group launched Bitcoin Cash futures, and the first block trade took place on October 20 between FalconX and GSR, as the CME Group announcement confirmed. The contracts come in a standard size of 250 BCH and a micro size of 25 BCH. Earlier in October, CoinGate also restored BCH payments for its merchants. Below, we compare forecasts for the next month, six months and year-end, look at long-term scenarios to 2050, and review the monthly technical signals, key levels and correlation with Bitcoin and Ethereum.
| Current BCH Price | BCH Price Prediction 2026 | BCH Price Prediction 2030 |
|---|---|---|
| $281.89 | $335.18 | $698.08 |
Article contents
- 1 Short-Term Bitcoin Cash Price Targets (month, half-year, end of year)
- 2 Long-Term Bitcoin Cash Prediction (2026-2050)
- 2.1 Bitcoin Cash Price Prediction 2026
- 2.2 Bitcoin Cash Price Prediction 2027
- 2.3 Bitcoin Cash Price Prediction 2028
- 2.4 Bitcoin Cash Price Prediction 2029
- 2.5 Bitcoin Cash Price Prediction 2030
- 2.6 Bitcoin Cash Price Prediction 2035
- 2.7 Bitcoin Cash Price Prediction 2040
- 2.8 Bitcoin Cash Price Prediction 2050
- 3 Bitcoin Cash Technical Analysis
- 4 BCH Key Price Levels
- 5 Popular Bitcoin Cash Moving Averages and Oscillators
- 6 Correlation
- 7 Is Bitcoin Cash a Good Investment?
- 8 Bitcoin Cash Price Prediction FAQ
- 8.1 What Is BCH’s Price Prediction Today?
- 8.2 What Is the Bitcoin Cash Price Prediction for This Week?
- 8.3 What Is the Bitcoin Cash Price Prediction for Next Week?
- 8.4 What Will the Price of Bitcoin Cash be Next Month?
- 8.5 What Is the BCH Price Prediction for 2026?
- 8.6 What Is the Bitcoin Cash Price Prediction for 2027?
- 8.7 What Is the Bitcoin Cash Price Prediction for 2030?
- 8.8 What Is the Bitcoin Cash Price Prediction for 2040?
- 8.9 What Is the Bitcoin Cash Price Prediction for 2050?
- 8.10 Will Bitcoin Cash Reach $500?
- 8.11 Will Bitcoin Cash Reach $1,000?
- 8.12 Will Bitcoin Cash Hit $10,000?
- 8.13 Can Bitcoin Cash Reach $100K?
- 8.14 How High Can Bitcoin Cash Go?
- 8.15 Will Bitcoin Cash Overtake Bitcoin?
- 8.16 Does Bitcoin Cash Have a Future?
- 8.17 What Affects the Price of Bitcoin Cash?
- 9 How to Buy Bitcoin Cash (BCH): Quick-Step Guide
Short-Term Bitcoin Cash Price Targets (month, half-year, end of year)
The following outlook uses BCH price predictions from CoinCodex, Changelly and CoinLore.
For the next 24 hours, CoinLore expects BCH to trade between $268.76 and $294.95, with a $276.69 target for tomorrow. CoinCodex’s daily path is flatter. It keeps BCH between $278.75 and $280.65 through October 31.
For next week, the two models point in different directions. CoinCodex expects a climb to between $283.45 and $289.43 (+0.6% to +3%), while CoinLore’s central target is $274.58 (-3%). On the daily chart, CoinLore places support near $271.25 and $268.44, with resistance at $284.17 and $289.01. The 200-day EMA near $304.13 is the next major barrier above those levels.
| Period | Minimum Price | Average or Central Target | Maximum Price | Change From Current Price |
|---|---|---|---|---|
| Next Month: November 2026 | $324.53 | $358.71 | $396.62 | +27% |
| In Six Months: April 2027 | $272.02 | $362.47 | $442.47 | +29% |
| End of Year 2026 | $268.6 | $335.18 | $396.62 | +19% |
The table summarises short-term forecasts from CoinCodex and Changelly.
Both models expect BCH to recover in November, with the entire monthly range above today’s price. CoinCodex is more bullish, with a range of $347.99 to $396.62, while Changelly sees $324.53 to $356.67. For April 2027, CoinCodex expects $356.35 to $382.71, while Changelly allows for a dip back to $272.02 but also a higher ceiling of $442.47.
The year-end outlook is also positive. CoinCodex targets $382.78 (+36%) by the end of 2026, while CoinLore’s year-end base case of $126.72 is far more bearish. Its scenarios range from $76.03 to $840.16.
Long-Term Bitcoin Cash Prediction (2026-2050)
CoinCodex, Changelly and CoinLore all expect BCH to trade higher over the long term, but their paths differ. The table below summarises their forecasts. These are model-generated estimates, not guaranteed outcomes.
| Year | Minimum Price | Maximum Price | Average Price | Price Change |
|---|---|---|---|---|
| 2026 | $268.6 | $396.62 | $335.18 | +19% |
| 2027 | $121.05 | $958.89 | $350.24 | +24% |
| 2028 | $187.33 | $1,189.9 | $566.66 | +101% |
| 2029 | $196.97 | $1,962 | $723.42 | +157% |
| 2030 | $287.91 | $2,229 | $698.08 | +148% |
| 2035 | $848.02 | $4,772 | $1,171.88 | +316% |
| 2040 | $930.98 | $9,628 | $1,990.87 | +606% |
| 2050 | $1,232.99 | $2,291.89 | $1,778.79 | +531% |
CoinCodex and Changelly give broadly similar ranges for most years, while CoinLore’s bear and bull scenarios explain the very low minimums for 2027 to 2029 and the high maximums for 2035 and 2040. CoinLore does not forecast 2050, so the 2050 maximum is lower than the 2040 figure.
Bitcoin Cash Price Prediction 2026
CoinCodex expects BCH to trade between $278.75 (-1%) and $396.62 (+41%) for the rest of 2026, with an average of $357.72.
Changelly’s range is narrower at $268.6 (-5%) to $356.67 (+27%), with an average of $312.64.
Bitcoin Cash Price Prediction 2027
CoinCodex forecasts $295.05 (+5%) to $841.85 (+199%) for 2027, with an average of $463.82.
Changelly is more cautious, with a range of $269.46 (-4%) to $614.07 (+118%). CoinLore’s base case of $201.76 (-28%) is the most bearish, although its bull case reaches $958.89.
CME futures could matter here. Regulated derivatives make it easier for funds to trade BCH, and they are often seen as an early step toward other institutional products.
Bitcoin Cash Price Prediction 2028
CoinCodex expects $586.75 (+108%) to $1,189.9 (+322%) in 2028, the year of Bitcoin Cash’s next block reward halving.
Changelly’s range runs from $303.91 (+8%) to $1,168.49 (+315%), and CoinLore’s base case is $312.22 (+11%).
Bitcoin Cash Price Prediction 2029
CoinCodex forecasts $771.5 (+174%) to $1,188.62 (+322%) for 2029, while Changelly sees $594.37 (+111%) to $1,168.39 (+314%).
CoinLore’s base case is $328.28 (+16%), with a bull scenario of $1,962.
These projections do not establish a predetermined market cycle. Payment adoption, competition from stablecoins and other low-fee networks, and wider market conditions could produce very different results.
Bitcoin Cash Price Prediction 2030
CoinCodex places BCH between $544.74 (+93%) and $1,188.18 (+322%) in 2030, with a year-end target of $824.72.
Changelly’s range of $538.29 (+91%) to $1,167.2 (+314%) is almost identical. CoinLore’s base case is $479.84 (+70%), and its bull case reaches $2,229 (+691%).
Bitcoin Cash Price Prediction 2035
CoinCodex forecasts $963.31 (+242%) to $1,169.28 (+315%) for 2035, and Changelly sees $848.02 (+201%) to $1,100.81 (+291%).
CoinLore is much more optimistic, with a $1,547 base case and a bull case of $4,772 (+1,593%).
Bitcoin Cash Price Prediction 2040
CoinCodex projects $1,299.12 (+361%) to $1,571.04 (+457%) for 2040, while Changelly’s range is $930.98 (+230%) to $1,446.21 (+413%).
CoinLore’s scenarios run from $2,073 to $9,628 (+3,316%), with a $3,455 base case. Because BCH’s supply is capped at 21 million, $9,628 would imply a market capitalization of about $194 billion at today’s supply and roughly $202 billion once all coins are mined.
Bitcoin Cash Price Prediction 2050
CoinCodex estimates $1,864.5 (+561%) to $2,291.89 (+713%) for 2050, with an average of $2,016.8. Changelly’s range is $1,232.99 (+337%) to $2,017.17 (+616%).
These forecasts are highly theoretical. More than two decades of technological change, regulation and competition separate today’s market from 2050, and no forecast establishes how high BCH will actually trade.
Bitcoin Cash Technical Analysis
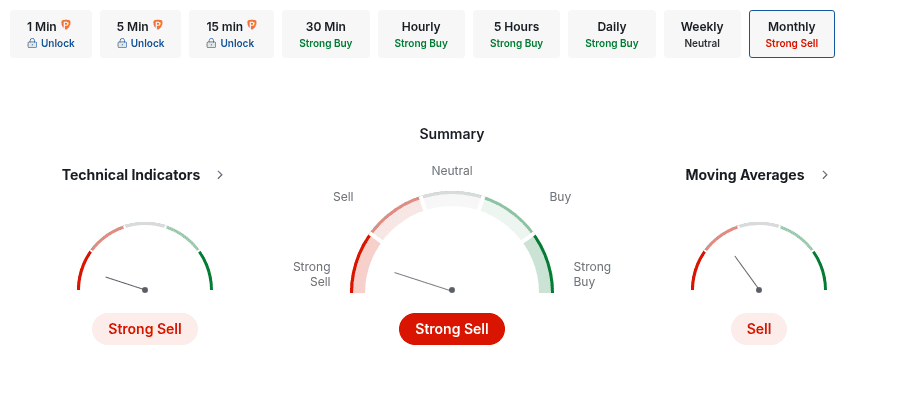
Investing.com gives BCH an overall Strong Sell rating on the monthly timeframe. Within that summary, technical indicators signal Strong Sell (1 buy, 0 neutral, 9 sell), while moving averages signal Sell (1 buy, 9 sell).
Investing
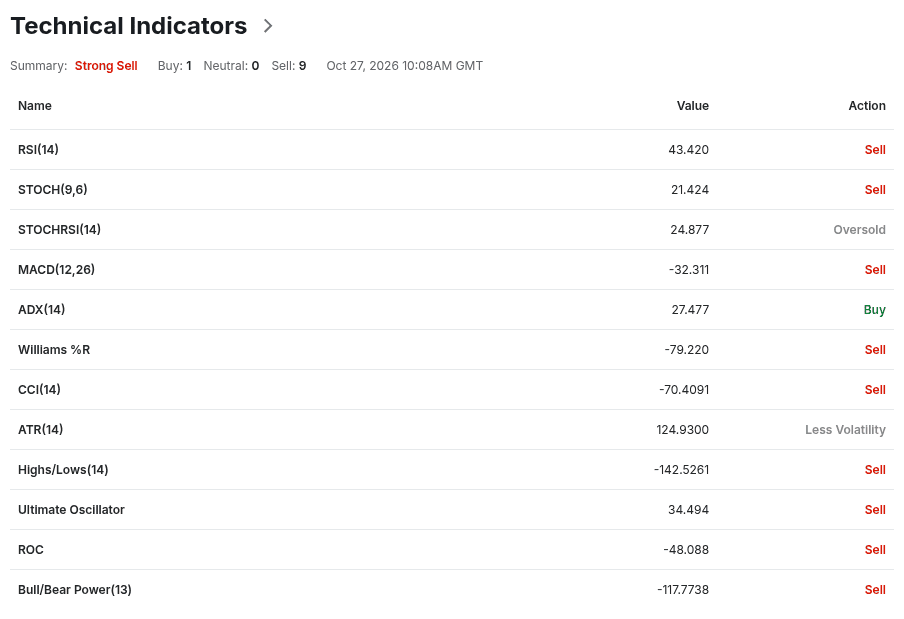
The monthly RSI (14) stands at 43.42, below the neutral 50 line, which shows that sellers have had the upper hand in recent months. MACD at -32.311, ROC at -48.088 and Bull/Bear Power at -117.7738 also signal Sell.
Investing
Some oscillators are close to exhaustion. STOCHRSI at 24.877 reads Oversold, and Williams %R at -79.22 sits just above the oversold zone, while STOCH at 21.424, CCI at -70.4091 and the Ultimate Oscillator at 34.494 signal Sell. ADX at 27.477 signals Buy and points to a trend with some strength, which in this case is the downtrend.
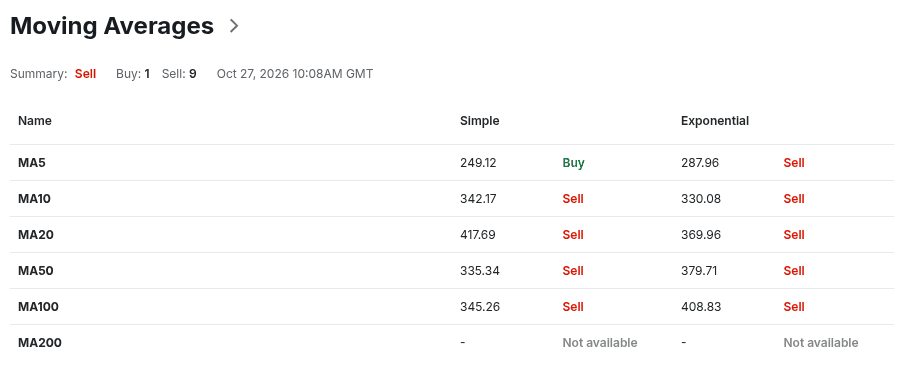
Moving averages are mostly bearish. BCH trades above its 5-month SMA of $249.12, the only Buy signal, but below the 5-month EMA of $287.96 and the 10-month SMA of $342.17. The 20-, 50- and 100-month averages all sit between $335 and $418.
On Investing.com’s monthly classic pivots, BCH sits between S1 at $224.24 and the pivot point at $295.05.
These signals describe trend conditions, not price targets.
BCH Key Price Levels
Investing.com’s monthly classic pivots place the pivot point at $295.05, about 5% above the current price.
| Level | USD Price |
|---|---|
| Resistance 3 | $529.99 |
| Resistance 2 | $447.93 |
| Resistance 1 | $377.12 |
| Pivot Point | $295.05 |
| Support 1 | $224.24 |
| Support 2 | $142.17 |
| Support 3 | $71.37 |
The pivot at $295.05 sits between the 200-day SMA of $289.11 and the 200-day EMA near $304.13, which makes the $290 to $305 zone the main hurdle for buyers. A monthly close above it would bring R1 at $377.12 into view, close to the CoinCodex range for April 2027.
On the downside, the 30-day low of $258.58 is the first support, followed by S1 at $224.24. The wide gaps between the lower supports reflect how volatile BCH’s monthly candles have been. These are calculated reference levels, not confirmed buying and selling zones.
Popular Bitcoin Cash Moving Averages and Oscillators
The following indicators use monthly candles from Investing.com.
| Indicator | Current Value | Signal |
|---|---|---|
| RSI (14) | 43.42 | Sell |
| STOCH (9,6) | 21.424 | Sell |
| STOCHRSI (14) | 24.877 | Oversold |
| MACD (12,26) | -32.311 | Sell |
| ADX (14) | 27.477 | Buy |
| Williams %R | -79.22 | Sell |
| CCI (14) | -70.4091 | Sell |
| Ultimate Oscillator | 34.494 | Sell |
| ROC | -48.088 | Sell |
| MA5 (simple / exponential) | $249.12 / $287.96 | Buy / Sell |
| MA10 (simple / exponential) | $342.17 / $330.08 | Sell / Sell |
| MA20 (simple / exponential) | $417.69 / $369.96 | Sell / Sell |
| MA50 (simple / exponential) | $335.34 / $379.71 | Sell / Sell |
| MA100 (simple / exponential) | $345.26 / $408.83 | Sell / Sell |
MA200 is excluded because Investing.com does not show a monthly value for it.
Investing
A simple moving average gives each closing price equal weight. An exponential moving average puts more weight on recent candles. The fact that BCH trades below almost all of them shows that the monthly trend has turned down over the past year.
Overall, the monthly picture is bearish, but the oversold STOCHRSI reading and a Williams %R close to oversold territory suggest that selling pressure may ease. A close back above the 5-month EMA would be the first sign of improvement.
Correlation
BCH’s daily returns had a strong positive correlation with Bitcoin and Ethereum over the last 30 days and a moderate one over 90 days and the past year.
| Pair | 30-Day Correlation | 90-Day Correlation | 1-Year Correlation |
|---|---|---|---|
| BCH–BTC | +0.72 | +0.59 | +0.6 |
| BCH–ETH | +0.74 | +0.51 | +0.56 |
The figures are based on CoinGecko daily prices over the past 30 days, 90 days and year.
Over longer periods, BCH usually follows Bitcoin, which is natural for a fork of the original chain. Over the 90-day window it gained about 31%, against roughly 25% for BTC and 21% for ETH.
The stronger 30-day reading shows that BCH has recently moved in step with the wider market, even after the CME launch. A broader sell-off would therefore likely weigh on BCH as well, although correlation can change quickly.
Is Bitcoin Cash a Good Investment?
Bitcoin Cash is one of the oldest and most liquid altcoins. It has a fixed supply of 21 million coins, low transaction fees and support from payment processors such as CoinGate. The launch of CME futures gives institutions a regulated way to trade it, which could deepen liquidity over time.
The risks are real. BCH trades more than 90% below its $3,785.82 all-time high, set in 2017, and has lost about 50% over the past year. Stablecoins and faster networks compete for the same payment use case, and large holders, including creditors of the former Mt. Gox exchange, could still sell coins.
The monthly technical rating is Strong Sell, although most short-term forecasts expect a recovery in the coming months. BCH may suit investors who want exposure to a long-established Bitcoin fork, but it remains a volatile asset. Whether it fits a portfolio depends on your risk tolerance and time horizon.
Bitcoin Cash Price Prediction FAQ
What Is BCH’s Price Prediction Today?
BCH is expected to trade between $268.76 and $294.95 today, around its current price of $281.89. Daily support sits near $271.25 and resistance near $284.17. These are model estimates, not guaranteed boundaries.
What Is the Bitcoin Cash Price Prediction for This Week?
BCH is forecast to trade between $278.75 and $283.45 this week.
What Is the Bitcoin Cash Price Prediction for Next Week?
BCH is forecast to trade between $274.58 and $289.43 next week, from about 3% below to 3% above the current price.
What Will the Price of Bitcoin Cash be Next Month?
BCH is expected to trade between $324.53 and $396.62 in November 2026, with an average of $358.71. That is about 27% above the current price.
What Is the BCH Price Prediction for 2026?
The BCH price prediction for 2026 is $268.6 to $396.62, with an average of $335.18, about 19% above the current price.
What Is the Bitcoin Cash Price Prediction for 2027?
Forecasts for 2027 range from $121.05 to $958.89, with an average of $350.24, about 24% above today’s price.
What Is the Bitcoin Cash Price Prediction for 2030?
Forecasts for 2030 range from $287.91 to $2,229, with an average of $698.08, about 148% above the current price. Most estimates stay below $1,200, while bullish scenarios lift the maximum.
What Is the Bitcoin Cash Price Prediction for 2040?
Forecasts for 2040 range from $930.98 to $9,628, with an average of $1,990.87, about 606% above the current price.
What Is the Bitcoin Cash Price Prediction for 2050?
Forecasts for 2050 range from $1,232.99 to $2,291.89, with an average of $1,778.79, about 531% above the current price.
Will Bitcoin Cash Reach $500?
Yes, BCH could reach $500 as early as 2027, and the average forecast passes that level in 2028. The target requires a gain of about 77% and implies a market cap of roughly $10 billion.
Will Bitcoin Cash Reach $1,000?
BCH could reach $1,000 in the late 2020s, as the highest forecasts for 2028 already exceed that level. The average forecast passes $1,000 in 2035. The target requires a gain of about 255% and implies a market cap of roughly $20 billion.
Will Bitcoin Cash Hit $10,000?
No forecast reviewed here reaches $10,000. The highest estimate is $9,628 for 2040. The target requires a gain of about 3,447% and implies a market cap of roughly $201 billion.
Can Bitcoin Cash Reach $100K?
No forecast suggests BCH will reach $100,000. The target implies a market cap of about $2 trillion, more than Bitcoin’s current value of roughly $1.6 trillion.
How High Can Bitcoin Cash Go?
The highest forecast reviewed here is $9,628, a model estimate for 2040. It is a speculative figure rather than a dependable ceiling, and it would imply a market cap of about $194 billion at today’s supply, well above most model averages.
Will Bitcoin Cash Overtake Bitcoin?
It is very unlikely. Bitcoin trades near $79,930 with a market cap of about $1.6 trillion, while BCH is worth about $5.7 billion, around 0.35% of Bitcoin’s value. No forecast reviewed here suggests that gap will close.
Does Bitcoin Cash Have a Future?
Bitcoin Cash still has an active payment network, a fixed supply, a large exchange presence and new regulated futures on CME. Its future depends on whether merchants and users choose it over stablecoins and other low-fee networks.
What Affects the Price of Bitcoin Cash?
BCH responds to Bitcoin’s direction, overall market liquidity and sentiment. Institutional products such as CME futures, merchant adoption, the 2028 halving, large holder sales, exchange listings and regulation also matter.
How to Buy Bitcoin Cash (BCH): Quick-Step Guide
Buying Bitcoin Cash is simple, even if you are a beginner. You do not need advanced knowledge or complicated tools. Platforms like StealthEX allow you to swap cryptocurrencies quickly and privately without creating an account.
StealthEX supports over 2,000 assets and enables direct wallet-to-wallet transfers. This means you stay in full control of your funds at all times.
Just follow these steps:
- Choose the crypto pair and enter the amount (for example, ETH to BCH).
- Click the “Start Exchange” button.
- Enter your Bitcoin Cash wallet address.
- Send the funds to the provided deposit address.
- Receive BCH directly in your wallet.
The process usually takes only a few minutes. You do not need registration, and you avoid unnecessary complexity. This makes it a convenient option for users who value speed and privacy.
If you prefer, you can also buy BCH on traditional exchanges. However, these platforms often require account verification and longer setup.

Follow us on Medium, X, Telegram, YouTube, and Publish0x to stay updated about the latest news on StealthEX.io and the rest of the crypto world.
Don’t forget to do your own research before buying any crypto. The views and opinions expressed in this article are solely those of the author.
BCH Bitcoin Cash crypto price prediction price analysis price predictionRecent Articles on Cryptocurrency